Black Friday is loading…
Get 40% off with Altrady’s yearly plan and take the lead.
.svg)
.svg)
.svg)
.svg)
.svg)
.svg)
.svg)
.svg)
.svg)
.svg)
.svg)
.svg)
.svg)

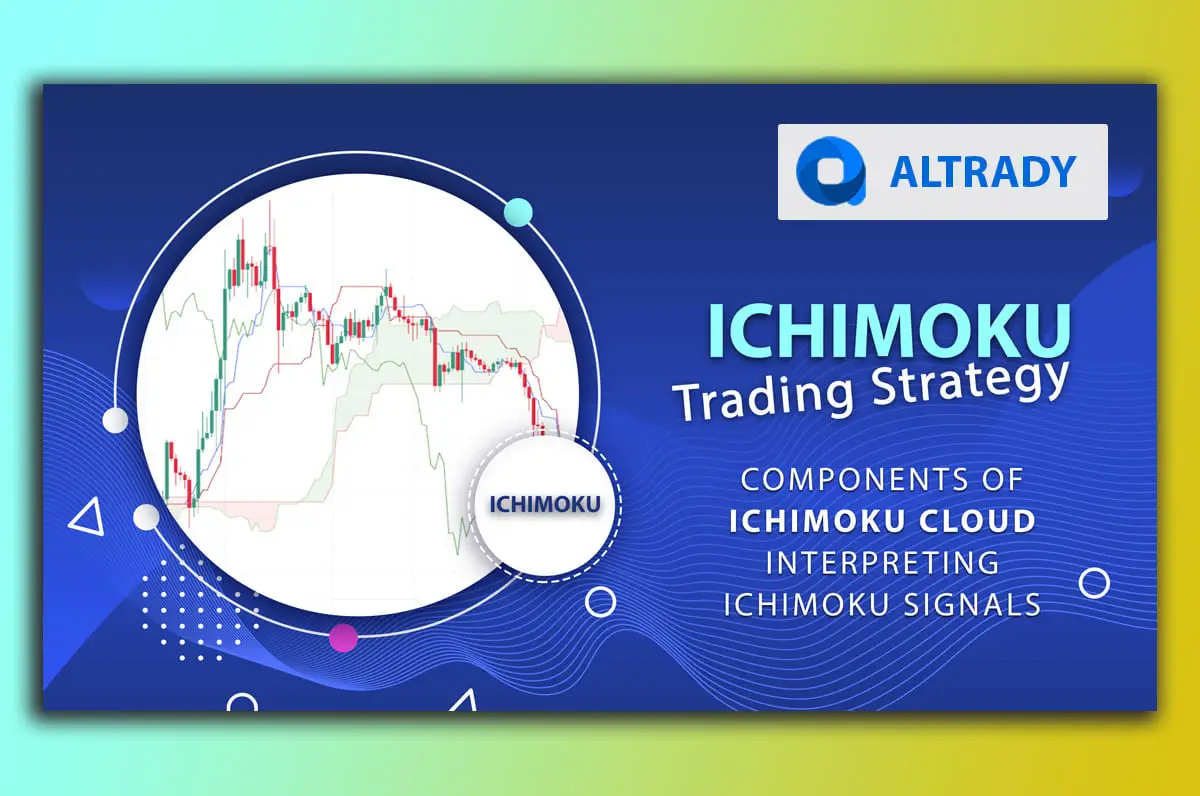
Ichimoku Cloud allows traders to implement analysis techniques combining multiple indicators in a single technical instrument. Is in essence a charting tool that tries to address the market events and price changes of an asset from a broader assessment viewpoint. For crypto traders it is like "a ring on the finger" letting them evaluate volatility at the time that they look for trend identification.
Published in the late 1960s by Japanese journalist Goichi Hosoda, Its history dates back to the 1930s. In this article we will explore the basis of this technical tool, what is an Ichimoku trading strategy, trying to understand its components and how to interpret its signals properly for the crypto market.

The Ichimoku is one the most complete indicators, empowered by several components that together aim to help conduct the broadest analysis possible about market volatility, trend seasons, overcoming sharpening price movements, and deciphering market sentiment.
Ichimoku can look quite complicated for traders when they see it for the first time.
However, for crypto traders, this strategy offers a wide range of applications across different market conditions, combining multiple tools in a single one. From identifying support and resistance to overbought and oversold conditions, the Ichimoku strategies stand out and will guarantee high-performance standards.
We can classify them into:
Before diving into the possible strategies of Ichimoku, let's overview the components of the indicator and how they react to price changes. These components are based on periods calculated over a certain number.
For an easy comprehension of the information, we could split this section into the component's names, characteristics, and then their description.

Tenkan-sen (Conversion Line): this line estimates the average of the highest high and lowest low over the past 9-periods, frequently plotted as a red line.
Kijun-sen (Base Line): Estimates the average of the highest high and lowest low over the past 26 periods, usually plotted as a blue line.
Senkou Span A (Leading Span A): It is the midpoint between the Tenkan-sen and Kijun-sen projected 26 periods ahead, plotted as a light green cloud.
Senkou Span B (Leading Span B): It measures the average of the highest high and lowest low over the past 52 periods, projected 26 periods ahead, and normally plotted as a dark green cloud.
Chikou Span (Lagging Span): This is the closing price of the current day plotted 26 periods behind, typically plotted as a dark blue line.
Now that we described each component, let's try to craft strategy exemplars. For this section, here is a table outlining them:
Trend |
Chikou Span |
Breakouts |
Support and |
|---|---|---|---|
|
Bullish Cloud: Bearish Cloud: |
Bullish Signal: Bearish Signal: |
Bullish Breakout: Bearish Breakout: |
The Cloud: The cloud itself can act as a dynamic support or resistance zone. Price may find temporary support to bounce off the bottom of the cloud during an uptrend, or encounter resistance at the top of the cloud during a downtrend. |
Understanding the components and knowing strategies may not be enough for the proper use of this indicator. Traders need to use a setting for the right interpretation of the signals spotted by the Ichimoku indicators.
For crypto trading, in particular, we should mention that during the time that Goichi Hosada improved the indicator, he developed and optimized it for the daily chart. Additionally, he designed this indicator for trading the Japanese stock market, which was open from Monday to Saturday.
Typically, crypto traders set the indicator for the 10, 30, and 60 values in substitution of the original settings, 9, 26, and 52, to reflect the 24/7 nature of crypto markets.
Confirmation: Combine Ichimoku with other technical indicators, like RSI or MACD, and fundamental analysis for confirmation of suspicious signals.
Cloud Thickness: A thicker cloud supports the thesis for a more established and stronger trend. Otherwise, a thin cloud implies a period of consolidation or possible trend shift.

Even though Ichimoku is a complex indicator addressing different viewpoints of the market, traders should not miss on risk concerns.
Consider:

Ichimoku Cloud is by far one of the most complete indicators for analyzing the markets in general and especially for the crypto market can serve as a powerful instrument since it integrates several technical concepts into one single tool.
Ichimoku suits better for higher timeframes, however it can be settled for crypto environments and lower timeframes. In Altrady you can find a wide range of options to start testing Ichimoku strategies, enrolling now through a free trial account.