
What is Support and Resistance in Crypto Trading
Chapters
In crypto trading, mastering the art of predicting market movements is one of the keys to success. Among the main tools that traders employ in predicting cryptocurrency prices and making informed decisions is the concept of support and resistance.
Below, you’ll find out more about support and resistance, how to identify them on a chart, and how to use them to your advantage.

Understanding Support and Resistance
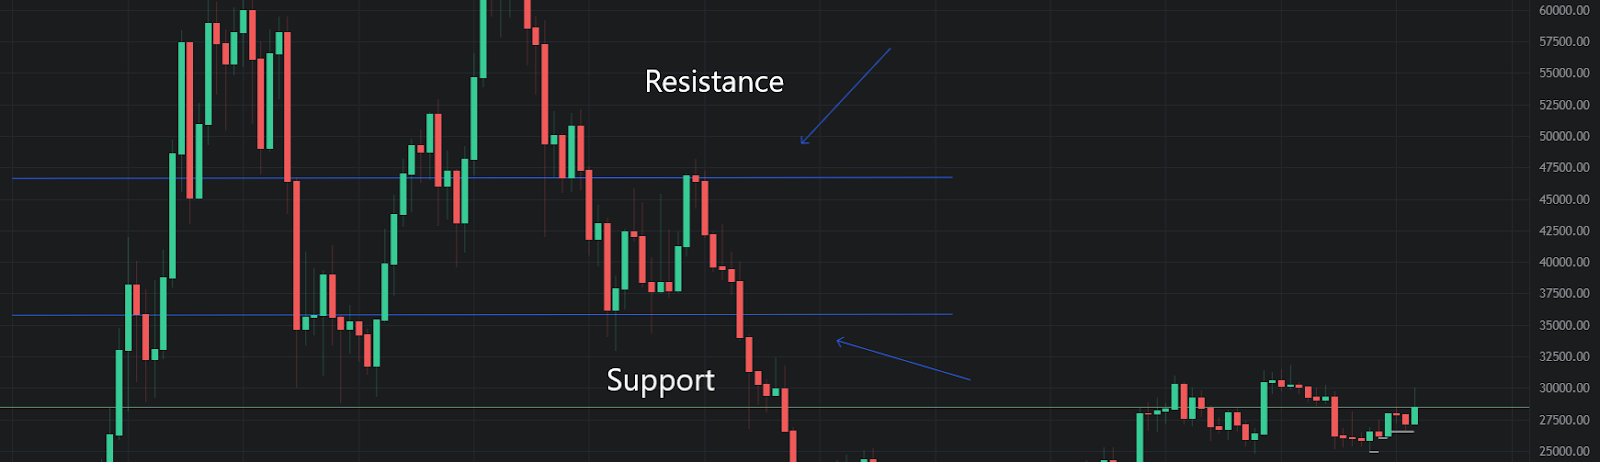
Support and resistance are two of the most basic and important concepts in technical analysis. They refer to the levels where an asset’s price tends to bounce or reverse due to the presence of buyers or sellers. Support is the level where the price finds buyers who prevent it from falling further, while resistance is the level where the price finds sellers who prevent it from rising further. Understanding this interplay of supply and demand is essential in anticipating potential price movements.
Support is like a safety net that prevents the price from plummeting further. Support levels are crucial as they indicate a strong demand for the asset at that price. Traders often look at historical data to identify these levels, making them significant markers on a price chart.
On the flip side, resistance acts as a barrier that prevents the price from rising further.
Resistance levels are also vital because they represent a strong supply zone. Traders pay close attention to these levels as they can indicate potential selling opportunities.
Support and resistance can be horizontal or diagonal, depending on the market trend.
- Horizontal support and resistance are drawn as horizontal lines that connect the lows or highs of the price movements.
- Diagonal support and resistance are drawn as trend lines that connect the rising or falling lows or highs of the price movements.
Support and resistance levels are also influenced by market sentiment. Positive news or events can lead to a breakout of resistance, while negative news can trigger a breakdown of support.
That’s why you should closely monitor news, economic indicators, and market sentiment to gauge how these factors might affect support and resistance levels.
Check this video on how to correctly identify support and resistance:
Identifying Strong Support and Resistance Levels
To confirm whether a support or resistance level is valid, look for multiple price touches at that level. The more times a price has reacted to a level, the stronger it is.
- Multiple touches: a price level with repeated rejections or bounces indicates strong support or resistance.
- Liquidity zones: these levels often align with areas of high trading volume, where institutions and large traders execute significant orders.
- Historical reactions: if a price level has been tested multiple times in the past, it is more likely to hold in the future.
- Breakouts and retests: a former resistance can turn into support and vice versa when price action confirms a breakout.
Over time, however, support and resistance levels can weaken. If a support level is tested repeatedly, it may eventually break, leading to a sharp selloff.
When Should You Use Support and Resistance
Support and resistance can be used to identify potential entry and exit points for your trades, as well as to set your stop-loss and take-profit levels.
Let's explore how you can use them effectively in your crypto trading strategies.
Identify trends
One of the primary uses of support and resistance is to identify trends in the market. When an asset repeatedly bounces off a support level, it suggests an upward trend. Conversely, when an asset consistently fails to break through a resistance level, it indicates a downward trend.
For example, if the price breaks above the resistance line with strong momentum and volume, it could signal that the downtrend is over and a new uptrend is starting. You can then look for buy signals on pullbacks to the former resistance line, which now acts as support.
Spot entry and exit points
Support and resistance levels also serve as valuable indicators for entry and exit points. Most traders decide to buy near support levels and sell near resistance levels. This strategy helps them maximize their profits and minimize potential losses.
Place stop-loss orders
Support and resistance levels play an essential role in setting stop-loss orders as a risk management technique. Placing a stop-loss just below a support level or above a resistance level can help traders limit their losses in case the market moves against them.
For instance, you can look for sell signals near the resistance line, like bearish candlestick patterns, divergence with an oscillator, or a crossover of a moving average. On the other hand, if you’re looking for buy signals, check for candlestick patterns, convergence with an oscillator, or a crossover of a moving average near the support line.
Breakout trading
Breakout trading is a popular strategy that involves capitalizing on price movements when the market breaks through a support or resistance level. Traders look for opportunities to enter the crypto market when a breakout occurs, expecting the price to continue in the same direction as the breakout.
Here are some basic rules to follow when using support and resistance:
- the more times a level is tested, the stronger it becomes;
- when a level is broken, it can change its role from support to resistance, or vice versa;
- the longer a level holds, the more significant it becomes;
- the more confluence a level has with other indicators, like moving averages, Fibonacci retracements, or chart patterns, the more reliable it becomes.
Breakouts vs. Fakeouts
Not every breakout signals a new trend. A true breakout occurs when the price moves beyond a key level and sustains above or below it with strong volume. A fake breakout happens when the price briefly crosses a level but quickly reverses.
How to Spot a Fakeout
Wick rejections: if only the candle wick breaks a level without a full-body close, the breakout might be false.
Low volume: a breakout with weak trading volume often lacks conviction.
Immediate reversal: if the price quickly moves back inside the range, it signals a lack of commitment from buyers or sellers.
Get more details from this webinar:
Using Automated Tools for Support and Resistance Analysis
Manual charting can be time-consuming, but tools like the Crypto Base Scanner simplify the process by automatically identifying support and resistance levels. This scanner provides insights into:
- Liquidity Zones: it highlights areas with strong buyer and seller interest.
- Broken Bases: it identifies markets where the price has dropped below a previous base, signaling potential buy opportunities.
- Alerts and Notifications: traders can set up custom alerts for breakouts, liquidity sweeps, and other key market movements.
Trading Strategies Based on Support and Resistance
Once you've identified key levels, you can apply different trading strategies to capitalize on market movements.
1. Bounce Trading
Buy at support levels when the price shows signs of holding.
Sell at resistance levels when the price struggles to break higher.
Use stop-loss orders below support (for buys) or above resistance (for sells) to limit risk.
2. Breakout Trading
Enter a trade when the price breaks above resistance (for long trades) or below support (for short trades).
Confirm with volume analysis to avoid fake breakouts.
Place stop-loss orders just below resistance (for buys) or above support (for sells) to protect against false moves.
3. Liquidity Grab Strategy
Wait for the price to briefly break a support or resistance level before snapping back.
Enter trades in the direction of the original trend after a fake breakout.
This strategy works best in volatile markets with significant liquidity zones.
Dollar-Cost Averaging and Layered Orders
The Crypto Base Scanner strategy incorporates dollar-cost averaging (DCA) by placing multiple buy orders at different support levels. This approach ensures that traders get the best possible entry price while reducing risk.
How to Execute a Layered Order Strategy
- Identify strong support and resistance zones.
- Place multiple buy orders slightly above support levels.
- Distribute sell targets across different resistance levels.
- Adjust positions based on market conditions and liquidity.
Set Up Trades with Ladder Orders & Risk Management
Ladder orders allow traders to gradually enter or exit positions rather than placing a single large trade. This method ensures better price execution and risk management. Altrady’s Base Scanner helps traders automate ladder orders, making it easier to execute dollar-cost averaging effectively.
- Avoid slow grinds: if the price moves too slowly toward an entry, traders can use time-based close settings to cancel positions before they become unprofitable.
- Use Stop-Loss alternatives: while the strategy does not rely heavily on stop losses, traders can use cooldown functions to limit exposure to potential losses.
- Volume-based filtering: if you filter trades based on volume, you can avoid illiquid markets prone to large price swings.

Conclusion
Support and resistance are invaluable tools for traders seeking to navigate the intricate world of financial markets. Understand the dynamics of these key levels, so you can effectively implement them into your trading strategies, and gain a significant edge.
Remember, though, that trading is complex, and mastering it requires continuous learning and practice. Getting a solid grasp of how to use and apply support and resistance is a step in the right direction and one that will help you make more informed trading decisions.
Additionally, support and resistance are not exact levels but zones where the price tends to react. Therefore, you shouldn’t rely on them alone but rather use them in conjunction with other tools and techniques to confirm your analysis and improve your trading performance.
In this Article
- Understanding Support and Resistance
- Identifying Strong Support and Resistance Levels
- Breakouts vs. Fakeouts
- Using Automated Tools for Support and Resistance Analysis
- Trading Strategies Based on Support and Resistance
- Dollar-Cost Averaging and Layered Orders
- Set Up Trades with Ladder Orders & Risk Management
- Conclusion


