
If you have been in the crypto sphere for some time now, you probably have encountered the popular phrase "buy the dip", which insinuates that a current trend in a cryptocurrency is likely to continue. The pullback strategy addresses this approach and gathers key concepts to recognize potential opportunities.
At Altrady, we've helped thousands of crypto traders successfully use pullback strategies. This guide provides a practical, step-by-step approach to identifying and trading pullbacks in the cryptocurrency market
Through the following sections, we are going to unveil how this strategy works to identify potential pullbacks within trending markets.

Pullback Strategy: What is it?
All the financial markets tend to have varying seasons characterized by continuation and reversal price movements. As well as a market can be into a sustained trending period, it is a matter of time for the price to get involved in some retracement.
Cryptocurrencies are not an exception to this norm, and typically, traders will be dealing with pullbacks in a market. Depending on the trading style, pullbacks might be a period to capitalize on within an established trend.

The pullback strategy can be suitable for scalpers, day traders, swing traders, and long-term investors. As trending markets can be addressable from different time frames, there are no impediments for traders of all levels and styles to capitalize on a price correction.
Key Aspects of the Pullback Strategy
- Easy to learn.
- Simple to use by focusing solely on trending markets and price corrections.
- Suitable for all trading styles.
- Reduced risk.
Pullbacks vs. Reversals
Pullbacks are not reversals or significant retracements. Often, what is recognized as a pullback is a temporary dip in price caused by necessary corrections within a clear uptrend or downtrend.
Consider the following:
- While a pullback reflects a temporary setback in price, reversals represent the invalidation of a trend and its incapacity to continue the established trajectory.
- While a pullback may appear along sideways movements, a reversal may emerge during a significant move, such as breaking a trendline or the trend structure.

Factors Causing a Pullback
Pullbacks are corrections in a trend that can be caused primarily by traders taking profits and exiting their positions, partially or totally. This is the principal use of pullbacks: acting as a signal for securing profits during a considerable movement over time.
Advantage of a pullback
In a notable strong uptrend or downtrend, the price movements in favor of the trend direction might occur faster as traders and investors try not to miss the momentum at a better price and enter compulsively pushing the price rapidly.
The pullback in a trend can bring back an opportunity for those traders who were left out of the market, offering them a better entry price.
On the other hand, traders who are already in profit can sell a portion and then add even more to a position, averaging potential profits with better prices.
Disadvantage of a pullback
Pullbacks can also come with disadvantages for some participants and the overall performance of the trending market. Based on the previous scenario where traders are pushing the price by entering rapidly, we can point out some consequences of those movements:
- The same force that is pushing the trend will be pushing the pullback, causing temporary volatility. This is an effect of the high amount of liquidity injected into the market in a short period, very common in cryptocurrencies.
- Pullbacks can drive periods of uncertainty, leading to consolidation phases, and slowing down the trending season. For some traders, it might bring impatience to them.
|
Altrady's backtesting feature lets you test different pullback trading strategies on historical crypto data. |
Identifying Pullback Opportunities
The pullback strategy gathers various trading concepts for a clear identification of potential opportunities during price corrections. Concepts like support and resistance, drawing trendlines, and using Fibonacci will let traders effectively detect pullbacks and take advantage of them.

Let's explore some identification methods based on those concepts.
Support and Resistance
These levels might represent strong supply and demand zones on the historical price movements, where the price action has consistently discontinued or reversed significantly.
In the context of the pullback strategy, two scenarios can be spotted:
- During an uptrend, the pullback toward relevant support levels might be taken as a signal for a buying opportunity.
- In a downtrend, a pullback getting near resistance levels could indicate a potential selling opportunity.
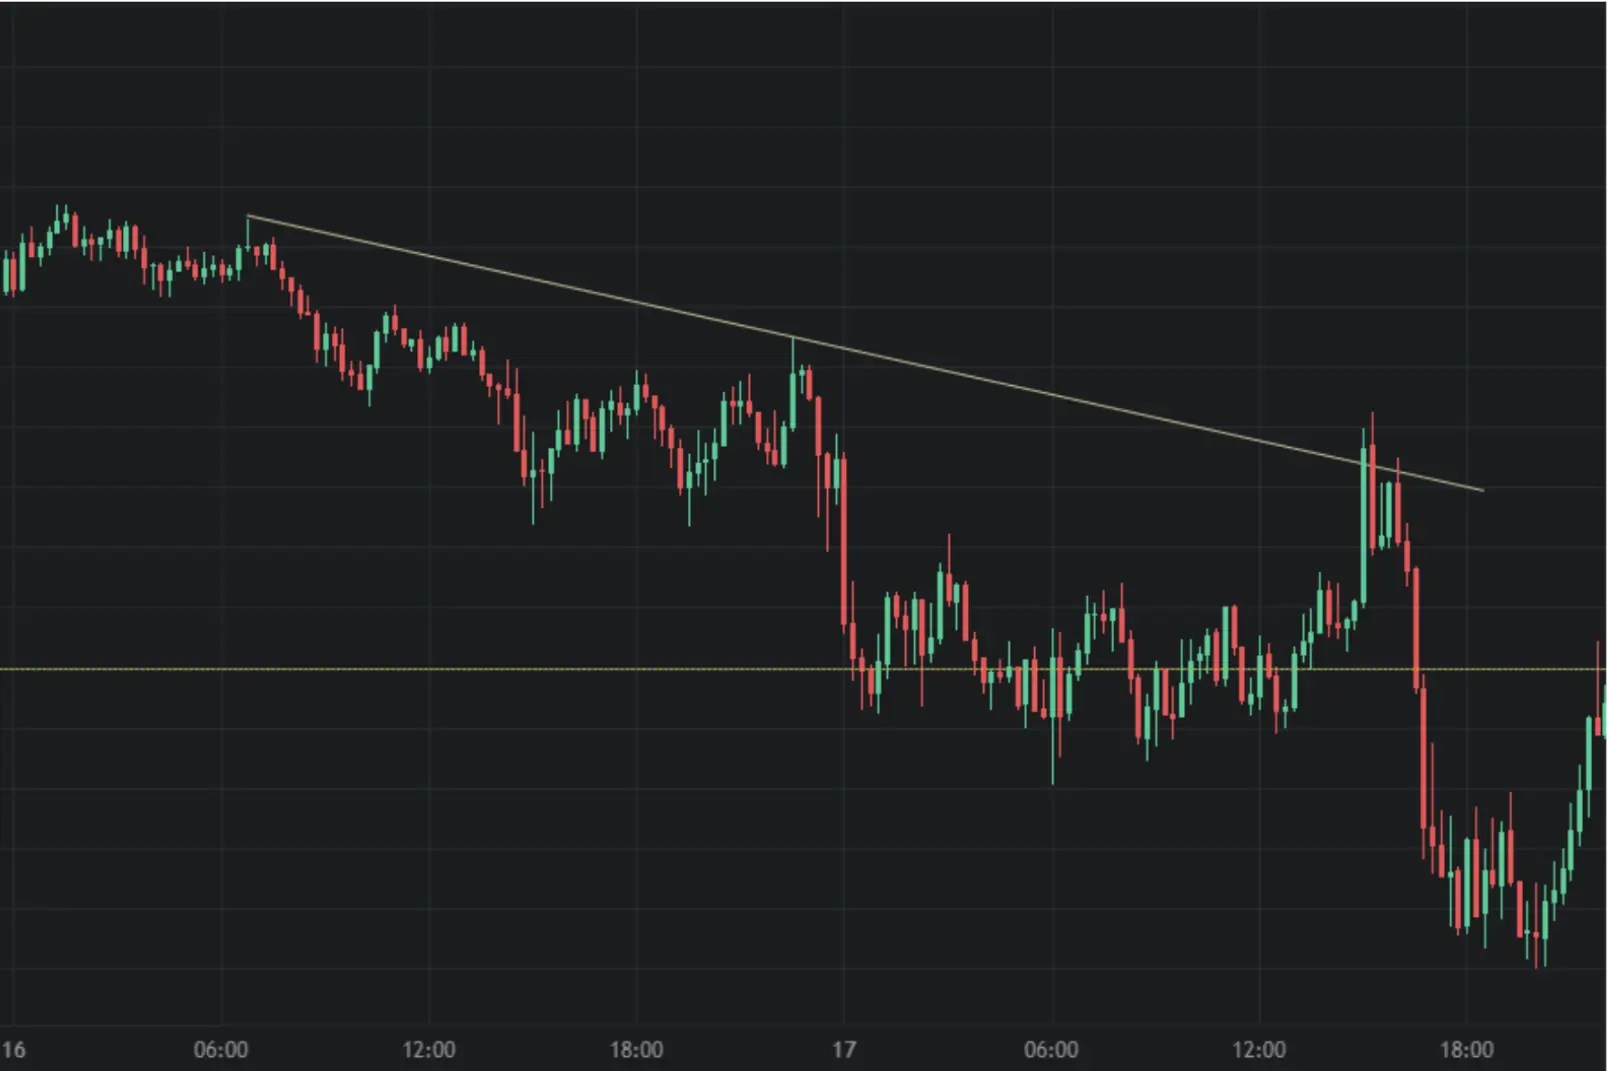
Drawing Trendlines
Drawing trendlines by joining the highs and lows of a trend will help traders follow the direction more clearly.
A pullback approaching the trend line can reveal a possible entry point aligned with the continuation of the trend.
Fibonacci Retracements
This is a popular charting tool that utilizes historical price movements to identify potential retracement levels. Plotting various horizontal lines representing a calculation of the Fibonacci retracements helps traders discover relevant zones for potential pullbacks.
Retracement calculations include levels like:
- 38.2%
- 50%
- 61.8%
Those percentages represent zones of possible supply and demand where price could find temporary support or resistance during a pullback.

How to Trade Pullbacks: A Step-by-Step Guide
Effectively identifying pullbacks allows traders to spot proper entry and exit opportunities amid the momentum-retracement phases of a trending market.
These phases are crucial to determine the direction of the prevailing trend:
- If the trend heads upward, the highs will be prominent.
- Conversely, when the trend goes downward, the lows are the most noticeable.
In essence, every momentum-retracement cycle shapes the trend, and the trend itself consists of the following swings:
- Uptrend: higher highs, higher lows.
- Downtrend: lower lows, lower highs.
- Momentums in an uptrend: These form the higher highs.
- Retracements in an uptrend: These form the higher lows.
- Momentums in a downtrend: These form the lower lows.
- Retracements in a downtrend: These form the lower highs.

By employing additional tools and concepts, traders can follow the trend direction and detect areas for trade setups. For example:
- Moving Averages: These indicators pinpoint the higher lows (uptrend) and the lower high (downtrend) as they move closely with the trend.
- Trendlines: Help traders join the higher highs or the lower lows to reveal the trend direction.
- Swing Highs/Lows: Unveil key levels of support and resistance in prior swings.
- Fibonacci Retracements: Suggest potential retracements in terms of percentages, especially useful to anticipate support and resistance levels across multiple timeframes.

Moving Average (50-period).
Trendline.

Swing low acting as support, then becoming resistance.

Fibonacci Retracements tool.
Once identified the trend, to trade pullbacks, traders should follow the following steps:
- Spotting key levels and waiting for a pullback towards them.
- Looking for confirmation through candlestick patterns or indicators confluence.
- Setting an entry point following the confirmation patterns.
- Establishing potential exit points, ideally beyond prior swings.

|
Altrady's charting tools allow you to easily draw trendlines, Fibonacci retracements, and add indicators like RSI and moving averages. |
Technical Indicators For Confirmation
Identifying pullbacks is just a part of the game. Traders could also confirm those possible pullbacks by integrating technical indicators.
Relative Strength Index (RSI)
RSI is a champion indicator for measuring price momentum and detecting overbought/oversold conditions.
Traders can exploit two approaches with RSI:
- In an uptrend, a price pullback coinciding with the RSI below 70 value (possibly oversold) indicates a buying opportunity.
- In a downtrend, a pullback aligning with the RSI rising above 30 (oversold) could suggest a shorting opportunity.
Using Moving Averages
These indicators smooth out the price fluctuations, exposing the prevalent trend direction. Pullbacks approaching a relevant moving average, for example, 50-day or 200-day SMA or EMA, can present a potential entry point converging with the continuation of the trend.
Confirmation with Volume
During a trending market, for the downside or the upside, increasing volume alongside a pullback towards reliable support or resistance levels suggests stronger pressure in favor of the trend, suggesting a more worthy pullback. Otherwise, a decreasing volume can potentially invalidate the continuation of a trend after the pullback.
Conclusion
The pullback strategy is so far a simple method aiming to capitalize on price retracements during trending markets.
It can be combined with charting tools and technical indicators to identify and confirm potential price retracements, implementing concepts related to support and resistance, trendlines, and Fibonacci retracements.
In Altrady you can find all of these charting tools and indicators to start trading pullback opportunities. You can Sign up now for a free trial account now.