
Chapters
.svg)
Market Structure in Smart Money Trading: Swing Highs, Swing Lows, and Trend Dynamics
Market mechanics are essential to understanding price movements and trends in financial markets. Traders rely on structural elements like Swing Highs and Swing Lows to identify potential trend reversals and confirm market direction. However, additional factors influence market dynamics and indicate changes in movement direction.
Explore these concepts in-depth and gain valuable insights into trend identification, market dynamics, and structural breaks.
What Are Trend Movements
A trend movement occurs due to significant buying or selling activity. This movement is characterized by a sequence of rising or falling price highs and lows. The formation of a valid trend requires two key components:
- Impulse Movements – These align with the primary trend direction, showcasing strong market momentum.
- Correction Movements – These are temporary pullbacks against the primary trend before the price continues in its original direction.

How to Confirm an Uptrend or Downtrend
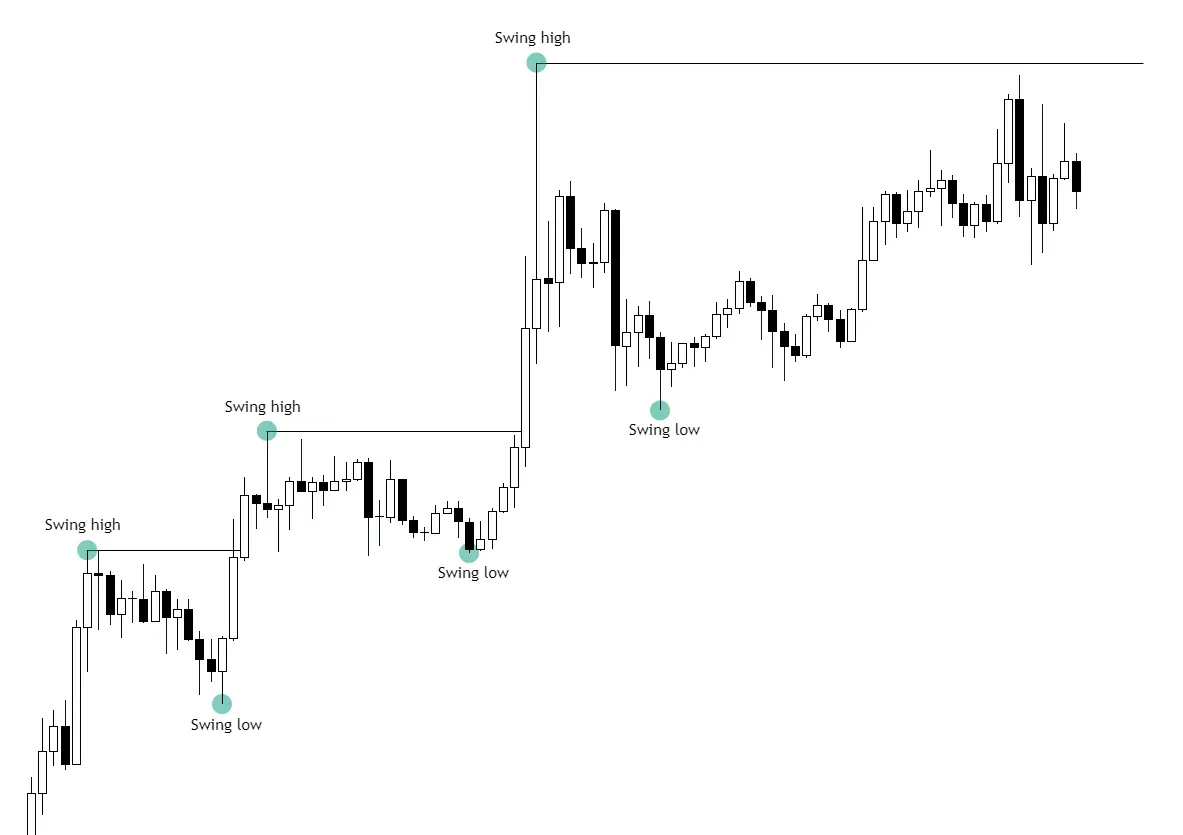
- Uptrend Confirmation: A new Swing High must surpass the previous Swing High that initiated a corrective movement. A candle body breaking this level confirms an uptrend.
- Downtrend Confirmation: A new Swing Low must break the previous Swing Low that initiated a corrective movement. A candle body breaking this level confirms a downtrend.
Once you analyze these structural movements, you can validate trends and avoid false signals.

Market Dynamics: Impulse vs. Correction Movements
The financial market naturally oscillates between impulse movements and corrections. Understanding these dynamics helps traders determine whether the market is trending or consolidating.
Impulse Movements: Strong directional moves aligned with the overall trend.
- In an uptrend, impulses occur between Swing Low and Swing High.
- In a downtrend, impulses occur between Swing High and Swing Low.
Correction Movements: Temporary retracements against the main trend.
- In an uptrend, corrections occur between Swing High and Swing Low.
- In a downtrend, corrections occur between Swing Low and Swing High.

Since the market seeks balance, larger impulses often result in larger corrections. Traders must identify whether price movements represent a continuation of the trend or a potential reversal.
Strong vs. Weak Swings
Swing Highs and Swing Lows play a crucial role in market structure. They can be categorized into two types:
Strong Swings
Definition: A Strong Swing is a significant price reaction that continues the initial movement.
Formation: Often forms within the range of a previous swing, leading to a structural update and invalidating weak swings.
Trend Application:
- Uptrend: A Strong Swing forms within the range of Swing Lows.
- Downtrend: A Strong Swing forms within the range of Swing Highs.

Weak Swings
Definition: A Weak Swing has minimal impact on the overall trend movement.
Reaction: These swings rarely cause strong price reactions and are often broken, leading to a structural update.
Break of Structure (BoS) and Market Trend Continuation
Break of Structure (BoS)
A Break of Structure (BoS) occurs when the price updates a key trend low (Strong Low) in an uptrend or a key trend high (Strong High) in a downtrend. It signifies a potential trend reversal.

Uptrend to Downtrend: When the price updates a Strong Low with a candle body closure, it signals a bearish Break of Structure.
Downtrend to Uptrend: When the price updates a Strong High with a candle body closure, it signals a bullish Break of Structure.
Confirmation (Conf)
Definition: Confirmation validates a structural break and ensures a market shift.
Purpose: It clarifies that the market has shifted priorities and is moving in the opposite direction. Traders use this as an early reversal signal.

Identifying Structural Movement
If you want to correctly determine market structure shifts, you must identify key structural points responsible for trend reversals.
- In an Uptrend: The absolute Strong Low that initiated the movement updating the next Weak High becomes the structural break point.
- In a Downtrend: The key Strong High that initiated the movement updating the next Weak Low serves as the structural break point.
A true Break of Structure is confirmed when a candle body closes above or below a key high/low. If there is no candle closure, the movement may be a Fake BoS (price manipulation).

What is a Fake BoS?
A Fake BoS occurs when:
- The price sweeps liquidity from a key swing without confirming a directional change.
- The price updates a key swing but fails to break the next structural point, indicating a lack of strong market intent.
Such manipulative moves often result in a rapid price return to its original direction.
Find more practical insights about market structure from this webinar:
Conclusion: Key Takeaways for Identifying Market Structure
Correctly identifying the market structure is the key to effectively analyzing price action and determining valid trading zones.
The following principles guide accurate trend assessment:
1. Trend Validation
- Uptrend: Each Swing High update confirms a continuing uptrend.
- Downtrend: Each Swing Low update confirms a continuing downtrend.
2. Structural Impulse and Correction
Uptrend:
- Impulse: Between Swing Low and Swing High.
- Correction: Between Swing High and Swing Low.
Downtrend:
- Impulse: Between Swing High and Swing Low.
- Correction: Between Swing Low and Swing High.
3. Update Validation
A structure update is only valid when a candle body fully closes above/below the key Swing High/Low.
If you follow these principles, you can make informed trading decisions, reduce false signals, and better predict market movements. Understanding market structure is a cornerstone of technical analysis, providing you with the tools needed to manage crypto market fluctuations effectively.


