
Chapters
.svg)
Points of Interest (POI) and Fibonacci in Smart Money Trading
Points of Interest (POI) are key market levels where significant price activity occurs. These levels serve as decision-making zones where institutions and retail traders react to price movements. POIs provide insights into market structure, liquidity, and potential reversals or trend continuations.
Common Types of POIs
- Fair Value Gaps (FVG)
Fair Value Gaps (FVG) are price inefficiencies caused by aggressive moves, leaving gaps in price action. These gaps are often revisited as the market seeks equilibrium.
Fair Value Gaps happen when the price moves quickly, creating gaps between candlesticks. The market often returns to these gaps to restore balance.
An FVG forms when a strong price movement leaves a space between the high and low of nearby candles.
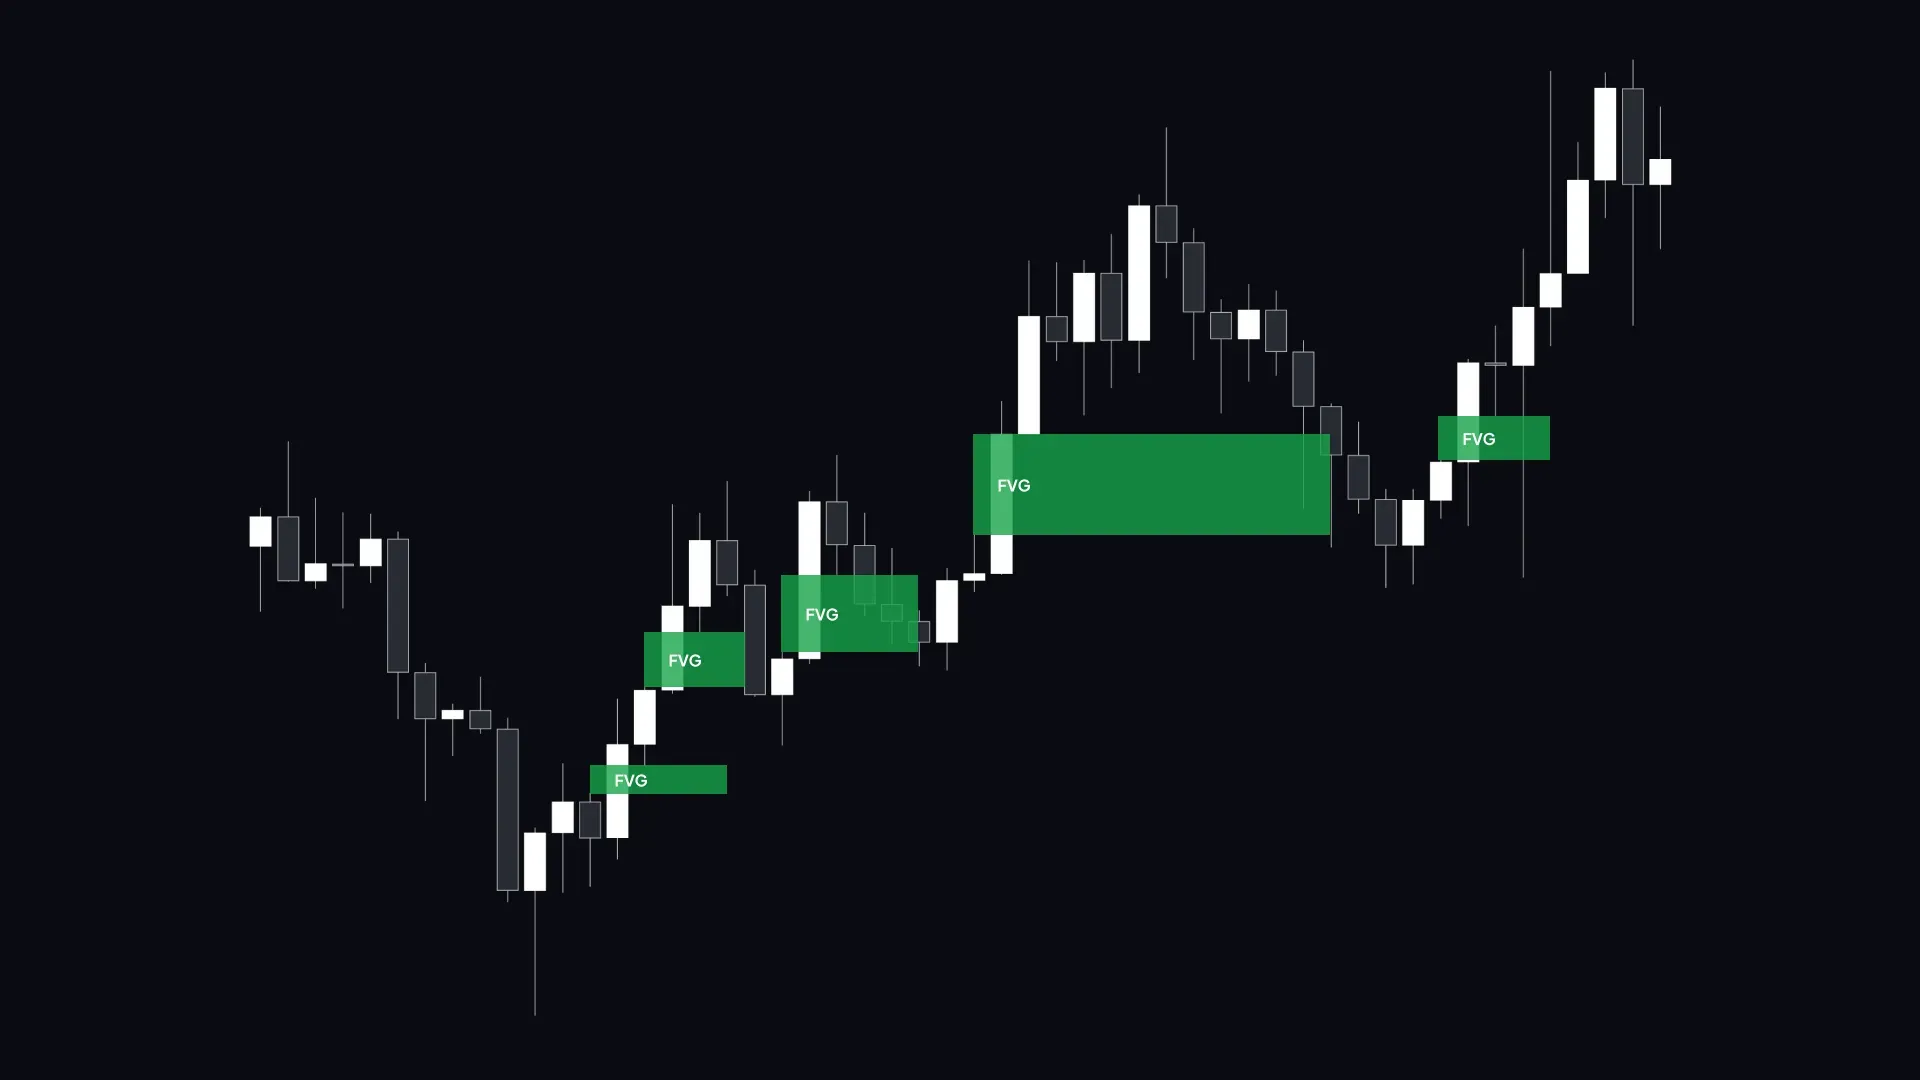
These gaps show an imbalance between buyers and sellers, making them likely areas where price may return.
Traders watch FVGs to predict possible pullbacks before the trend continues.
2. Order Blocks (OB)
Order blocks represent areas where large institutional orders were placed. These zones often act as support or resistance levels, as smart money tends to revisit these areas to execute additional orders.

- Bullish Order Block: A previous bearish candle before an impulsive bullish move. Price often returns to this zone for buy entries.
- Bearish Order Block: A previous bullish candle before an impulsive bearish move. Price revisits this area for sell entries.
Price often revisits OBs before continuing in the original direction. Strong OBs align with liquidity zones and other confluences for high-probability trades.
3. Breaker Blocks (BB)
Breaker blocks are former support or resistance levels that flip after a strong price move. A breaker block signals that previous liquidity has been absorbed, making it a crucial level for smart money traders.
- Bullish Breaker Block: A resistance level that, once broken, turns into support.
- Bearish Breaker Block: A support level that, once broken, turns into resistance.
A Breaker Block can be a strong confluence tool when combined with liquidity zones and market structure.

4. Rejection Blocks (RB)
Rejection Blocks (RB) appear when the market strongly rejects a price level, leaving wicks as signs of failed breakouts. These zones often become areas of interest for smart money traders.
RBs signal strong resistance or support, often leading to reversals or trend continuation.
They tend to form near liquidity pools where institutional traders trigger stop losses and pending orders.

Smart money traders use RBs to identify areas where price is likely to react, helping them refine entry points for high-probability trades.
When combined with Fair Value Gaps (FVGs) or order blocks, RBs can offer confluence for trade setups.
Why POIs Matter
Institutional trading activity: institutions execute trades at these key levels, making them significant.
Market reversals & continuations: POIs help traders anticipate potential turning points or trend persistence.
Enhanced trade setups: when combined with Fibonacci levels, POIs provide high-probability trading opportunities.
Fibonacci Trading and Its Role in POIs
Fibonacci retracement is a technical tool that helps traders identify potential reversal zones by measuring the depth of price corrections. When aligned with POIs, Fibonacci levels add confluence to trade setups.
Fibonacci Retracement in Trading
The Fibonacci retracement tool is applied from:
- Swing Low to Swing High (for uptrends)
- Swing High to Swing Low (for downtrends)
Key Fibonacci Levels:
- 0.236 (23.6%) – Minor pullback level
- 0.382 (38.2%) – Shallow retracement
- 0.5 (50%) – Midpoint of the move (not a Fibonacci number but widely used)
- 0.618 (61.8%) – Golden ratio; strong retracement level
- 0.786 (78.6%) – Deep retracement, often tested before reversals
Premium and Discount Zones
Premium Zone (Above 0.5 Level) – Favorable for selling.
Discount Zone (Below 0.5 Level) – Favorable for buying.
Equilibrium (0.5 Level) – Represents a fair market price.
Optimal Trade Entry (OTE) with POIs
The Optimal Trade Entry (OTE) zone lies between the 0.618 and 0.79 retracement levels, making it an ideal area for high-probability trade entries. When a POI aligns with an OTE level, the likelihood of price reacting significantly increases.

How POIs and OTE Work Together
POIs mark critical decision zones.
If the price retraces into the OTE zone within a POI, the trade setup is stronger.
Institutional players often accumulate or distribute positions within this range.
Find more details from this webinar:
Steps for Using Fibonacci with POIs
1. Identify Market Swings
Traders start by pinpointing key swing highs and swing lows on the price chart. These levels form the foundation for plotting Fibonacci retracement levels and assessing potential price movements.
2. Map Fibonacci Levels
Once the significant highs and lows are identified, traders apply Fibonacci retracement to visualize potential retracement zones where price might stall or reverse before continuing in the prevailing trend direction.
3. Find Confluence with POIs
After plotting Fibonacci levels, traders seek Points of Interest (POIs) that coincide with key retracement areas. For instance, if a Bullish Order Block is positioned around the 61.8% retracement level, it strengthens the likelihood of a potential buy opportunity.
4. Confirm Trade Entries
When aligning Fibonacci retracements with POIs, traders can enhance their trade execution strategies. They wait for price action confirmations—such as bullish or bearish candlestick patterns—at significant Fibonacci levels that overlap with a POI before committing to a trade.
How to Apply POIs and Fibonacci in Uptrends and Downtrends
Uptrend (Buying Scenario)
- Identify a POI (Order Block, Breaker, Liquidity Pool, or FVG).
- Draw Fibonacci retracement from Swing Low to Swing High.
- Look for the OTE zone (0.618-0.79) within the POI.
- Enter with confirmation (e.g., bullish candlestick patterns or Break of Structure (BOS)).
Downtrend (Selling Scenario)
- Identify a POI.
- Draw Fibonacci retracement from Swing High to Swing Low.
- Look for the OTE zone aligning with a POI.
- Enter with confirmation (e.g., bearish price action or resistance rejection).
Common Mistakes When Using POIs and Fibonacci
1. Expecting Fibonacci Levels to Always Hold
Not every retracement will respect Fibonacci levels. Price action and POIs should provide additional confirmation.
2. Ignoring Market Structure and POIs
Fibonacci retracement works best when used alongside strong POIs. Traders should analyze the broader market structure before placing trades.
3. Over-Relying on Fibonacci for Trade Entries
Fibonacci should serve as confluence, not the sole reason for entering a trade. Other technical and fundamental factors should support the decision.
Conclusion
Combining Points of Interest (POI) and Fibonacci retracement enhances trade setups by:
- Identifying optimal trade entries through key liquidity areas.
- Improving risk-to-reward ratios by targeting high-probability reversal zones.
- Providing confluence between price action, liquidity, and market structure.
If you can understand and apply POIs and Fibonacci, you’ll make more informed decisions and capitalize on high-probability opportunities in smart money trading.


