
Chapters
.svg)
Oscillator Indicators
Among the arsenal of analytical tools available, oscillators stand out as indispensable instruments for technical analysis.
If you’re eager to delve into the world of oscillators, check the comprehensive guide below, exploring what oscillators are, how they work, and why they’re essential for making informed trading decisions.

What are Oscillator Indicators
Oscillators are a class of technical indicators used in financial analysis to identify overbought or oversold conditions in various assets, such as stocks, currencies, commodities, and cryptocurrencies.
They play a key role in helping traders leverage the strength and momentum of price movements. Oscillators are mostly used for short-term traders, as they provide insights into potential reversals or trends that continue their course. They’re particularly valuable when the market is going sideways (i.e. in no clear direction).
Yet, oscillators are generally used along with other technical indicators to make the right trading decisions.
Key Characteristics of Oscillators
- Oscillating Values
One defining characteristic of oscillators is their ability to oscillate within a specific range, typically between 0 and 100. These values are then plotted on a separate chart beneath the price chart, making it easier to visualize potential buy or sell signals. - Overbought and Oversold Levels
Oscillators are equipped with overbought and oversold levels, typically set at 70 and 30, respectively. These levels serve as critical thresholds, indicating when an asset may be overbought (values over 70, indicating a selling opportunity) or oversold (values below 30, indicating a buying opportunity).
For example, if the average price of Ethereum was $30,000 last week and the average price is $70,000 this week, the oscillator would likely indicate overbuying because the price is appreciating.
How Oscillators Work
Oscillator indicators use mathematical formulas that measure positive and negative trends and divergences. These formulas use a combination of price data, like the closing prices, highs, and lows.
The mechanics behind oscillators center around this idea: when momentum begins to slow, it’s a sign of a potential trend reversal, and the price will likely change its direction.
This means that either fewer buyers (if it’s an uptrend) or fewer sellers (if it’s a downtrend) are willing to trade at the current price.
Let’s take one clear example:
Suppose you’re actively checking out Bitcoin’s daily price to see if it’s overbought or oversold. You decide to use the rsi'>Relative Strength Index (RSI) indicator and choose to collect Bitcoin’s historical price for the last 14 trading days.
Based on RSI’s formula, you’ll get a result that represents a ratio of average gain to average loss. Let’s imagine the RSI value is 60, which means Bitcoin is neither overbought nor oversold. The stock is balanced, with no extreme prices likely to follow.
The optimal trading decision in this case is to either hold your position or wait for an overbought or an oversold condition before entering or exiting a position.
Check a video tutorial that shows you the ins and outs of leveraging oscillators in your strategy:
Commonly Used Oscillator Indicators
Moving Average Convergence Divergence (MACD)
The MACD indicator shows the relationship between two moving averages of a security's price. The MACD can help you identify the direction and strength of the trend, as well as potential trend reversals.
MACD consists of three components:
-
MACD Line
The MACD Line represents the difference between the 12-period and 26-period EMA. When the MACD Line goes above the Signal Line, you can take this as a bullish signal that sugests a potential uptrend. Conversely, when it crosses below the Signal Line, it generates a bearish signal, indicating a potential downtrend. -
Signal Line
The Signal Line is a 9-period EMA of the MACD Line. It helps confirm trend changes and provides entry and exit signals. -
Histogram
On a chart, the MACD Histogram displays the difference between the MACD Line and the Signal Line. It helps traders visualize the strength of a trend. When the histogram is positive and increasing, it indicates a strong bullish moment.
The MACD also generates trading signals based on crossovers and divergences. A bullish crossover occurs when the MACD line crosses above the signal line, indicating that the price momentum is increasing to the upside.
A bearish crossover occurs when the MACD line crosses below the signal line, indicating that the price momentum is decreasing to the downside.
Relative Strength Index (RSI)
The Relative Strength Index is a momentum indicator that measures the speed and change of price movements on a scale from 0 to 100. The RSI can help you assess the overbought or oversold conditions of a market, as well as potential price reversals.
An RSI value that goes above 70 (considered a high RSI value), hints that the market is overbought; this means the prices went up too much and too fast and a correction or reversal will potentially occur.
When the RSI’s value goes below 30, this means the market is oversold, with prices that had fallen too much in a short time, indicating a bounce or reversal.

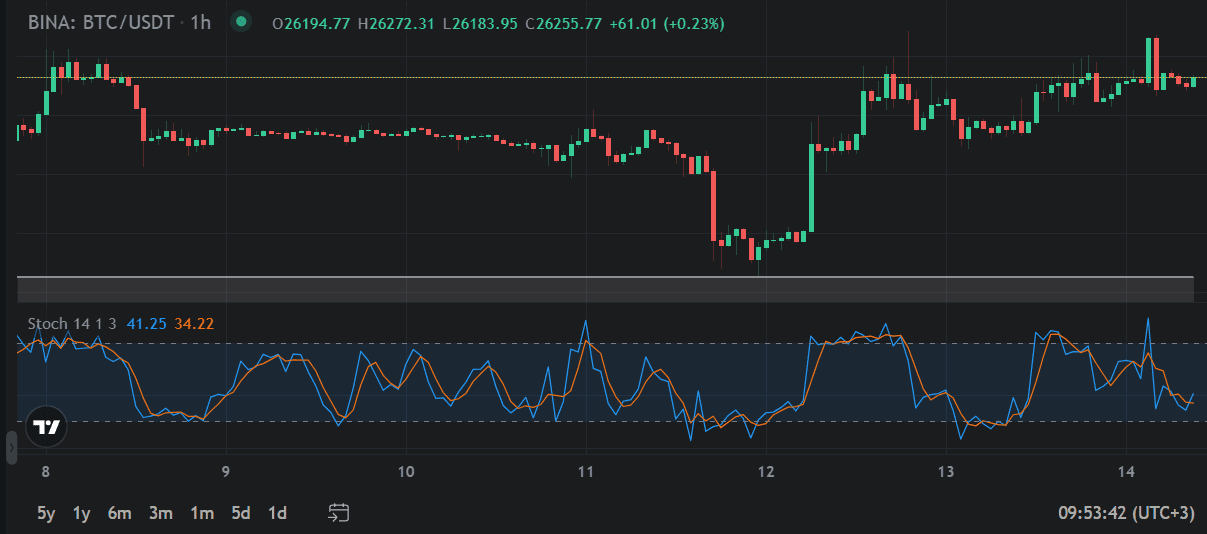
Stochastic Oscillator
The Stochastic Oscillator helps traders identify potential trend reversals. It compares the closing price of an asset to its price range over a specified period.
The Stochastic Oscillator consists of two lines:
-
%K Line
The %K Line defines the current closing price in relation to the price range over a specific period, usually 14 periods. When the %K Line crosses above 80, it’s a sign that the asset may be overbought. When his line goes below 20, it indicates that the asset may be oversold, signaling traders to a potential buying opportunity. -
%D Line
The %D Line is a smoothed version of the %K Line, often using a 3-period moving average. It helps confirm the indications the %K Line provides.
Valuable Insights that Oscillator Indicators Provide
Overbought/Oversold levels: when cryptocurrency prices are in an extreme trend, they fall into either the "overbought" or "oversold" category; oscillator indicators identify these conditions by analyzing whether the price trend has reached its limits.
Buy/Sell signals: oscillator indicators can generate buy and sell signals through a crossover strategy that looks into the following patterns: when an oscillator employs two moving averages, the intersection of these averages can signal the emergence of a new trend.
Trend trading: oscillator indicators can confirm a current trend; for instance, in the case of a potential bullish trend based on the price action, the oscillator will confirm this by moving to positive territory on the upper end and vice versa. Also, centerline crossovers (i.e. above or below 0) show the start of a new trend.
Day Trading: traders can develop an intraday oscillator strategy; by using weighted price data, oscillators will simply highlight a day's current trend, allowing you to trade without considering historical data.
Divergence Trading: an oscillator indicator can signal a potential divergence, either to the upside or downside, if it indicates different values compared to the ones from the current price trend (e.g., the price value of a cryptocurrency goes up, while the oscillator is descending).

Conclusion
In your quest to become a proficient trader, you should keep in mind that oscillators only show a part of the picture. Using other technical indicators, coupled with diligence and discipline, risk management, and a solid understanding of market fundamentals are essential in making informed trading decisions.


