For both beginner and experienced traders, the stochastic oscillator has gained significant popularity in the world of crypto trading. As an indicator that generates overbought and oversold signals, understanding the stochastic oscillator and how to interpret its values is essential in maximizing your crypto investments.
Below, you’ll learn all you need to know about this indicator, how it works, and the best practices to use stochastic in your trading approach.

What is The Stochastic Oscillator
The stochastic oscillator is a momentum indicator traders use to uncover overbought and oversold conditions, as well as potential trend reversals and divergences (when an asset’s price goes in the opposite direction of the technical indicator).
This indicator compares the closing price of an asset to its price range over a chosen period, generating values that range from 0 to 100.
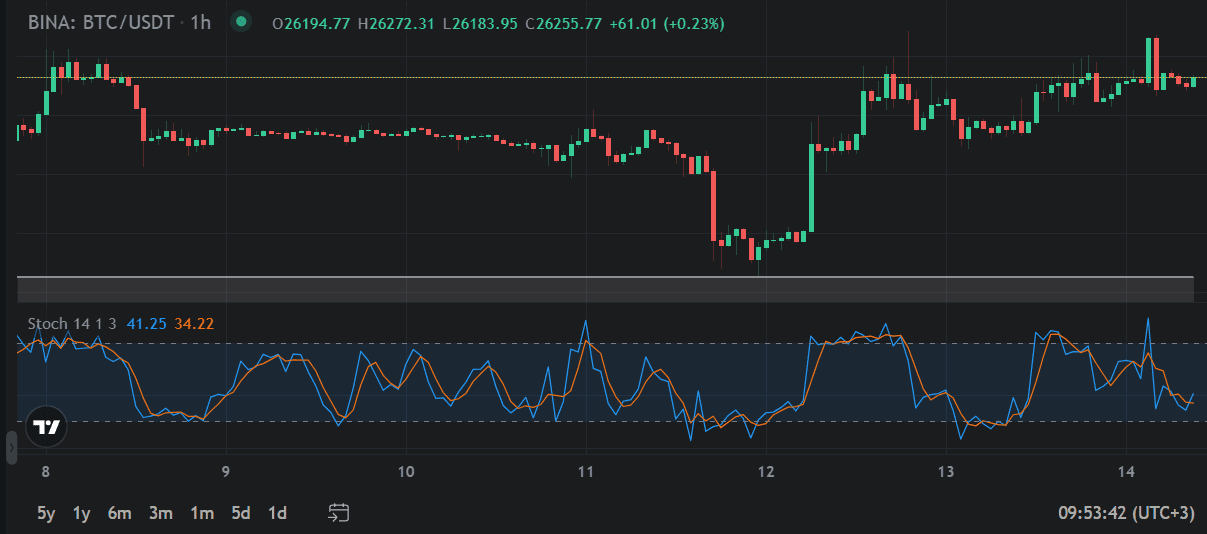
On a graphical chart, the representation of the stochastic oscillator covers two lines:
- %K Line
The %K Line is the indicator’s main line that represents the current price's position in relation to the range - %D Line
The %D line is a smoothed version of %K and is calculated by taking a simple moving average of %K over a specified number of periods, usually 3 periods. The %D line is less volatile and easier to interpret.
You can use the stochastic indicator to get a glimpse of the current market sentiment and translate stochastic’ values from the graph chart as follows:
- values close to 0 ➡️ bearish market
- values closer to 100 ➡️ bullish sentiment
How Does the Stochastic Oscillator Work?
The formula for the stochastic oscillator is:
%K = (C - L14) / (H14 - L14) * 100
Where:
C = The most recent closing price
L14 = The lowest price traded of the 14 previous trading sessions
H14 = The highest price traded during the same 14-day period
%K = The stochastic indicator’s current value
Then, the %D line generates trading signals based on the crossover of the %K and %D lines.
On a simple level:
- values above 80 suggest that a cryptocurrency is overbought, meaning traders can expect a potential reversal or correction in price;
- values below 20 suggest that a cryptocurrency is oversold, indicating a potential reversal to the upside.
Yet, this interpretation isn’t foolproof, and the stochastic oscillator can remain overbought or oversold for a long time during a strong trend.
Thus, you should also closely inspect other factors to confirm these signals.
How to Interpret Stochastic Oscillator Values
- Crossover signals: when the %K line crosses above or below the %D line, it indicates a change in momentum.
A bullish crossover occurs when the %K line crosses above the %D line from below 20, signaling a possible uptrend. A bearish crossover occurs when the %K line crosses below the %D line from above 80, signaling a possible downtrend.
- Divergence analysis: compares the price action of the cryptocurrency with the movements of the oscillator.
A divergence occurs when the price makes a new high or low, but the oscillator shows the opposite, or vice versa. This signals a weakening of the underlying trend, and a possible reversal or correction.
A bullish divergence occurs when the price makes a lower low while the stochastic oscillator makes a higher low, suggesting that the selling pressure is decreasing.
A bearish divergence occurs when the price makes a higher high while the stochastic oscillator makes a lower high, suggesting that the buying pressure is decreasing.
Combining Stochastic Oscillator with Other Technical Indicators
The stochastic oscillator isn’t enough to make profitable trading decisions. You need to use it with other indicators to confirm its signals and provide additional information about the market.
The most common combinations include using stochastic along with indicators, like:
Moving Averages
Moving averages can be used with the stochastic oscillator in two ways:
- you can use them as dynamic support and resistance levels to identify potential entry and exit points; a breakout above resistance or below support can signal a change in trend. For instance, if the price is above a rising moving average, it indicates an uptrend, and if the stochastic oscillator is below 20, it shows an oversold condition. This could be a good opportunity to buy a crypto asset, as the price will likely bounce back from the moving average.
- you can use moving averages as trend filters, where you only trade in the direction of the dominant trend; for example, if the price is above a rising moving average, it indicates an uptrend, and if the stochastic oscillator crosses above 80, it reveals an overbought condition. This could be a good opportunity to sell the asset, as the odds are the price will reverse from the overbought level.
Similar to moving averages, you can use the RSI and the stochastic oscillator as support and resistance levels, where the price tends to bounce or break through. For example, if the price is in a downtrend and the RSI is below 30, it indicates an oversold condition. If the stochastic oscillator also crosses below 20, it confirms the oversold signal and suggests a possible bounce from the RSI level.
You can also use these indicators as trend filters, where you only trade in the direction of the dominant trend. For example, if the price is in an uptrend and the RSI is above 70, it indicates an overbought condition. If the stochastic oscillator also crosses above 80, it confirms the overbought signal and suggests a possible reversal from the RSI level.
Bollinger bands can be used with the stochastic oscillator in several ways. One way is to use them as breakout indicators, where you trade when the price breaks out of the bands.
For example, if the price breaks above the upper band and the stochastic oscillator is above 80, it indicates a strong bullish momentum and a possible continuation of the uptrend.
Practical Applications of the Stochastic Oscillator in Crypto Trading
Crypto traders and investors can use the stochastic oscillator to spot this essential information:
-
Trend confirmation: the stochastic oscillator confirms the direction of the trend; if the stochastic oscillator is rising while the price is in an uptrend, it provides additional confirmation of the bullish trend.
-
Timing entries and exits: traders use the stochastic oscillator’s overbought and oversold conditions to decide on their entries and exits; they buy when the indicator is oversold and sell when it's overbought.
-
Divergence trading: divergence between the stochastic oscillator and price can be a powerful signal for potential trend reversals; traders can rely on these divergences to make contrarian trades.
- Filtering signals: traders use the stochastic oscillator in conjunction with other technical indicators to filter out false signals to improve the accuracy of trading strategies.

Conclusion
The bottom line is that the stochastic oscillator can help traders identify potential reversal points, overbought and oversold conditions, and divergence patterns. But, like any trading tool, it has its limitations, and you should it in conjunction with other analysis techniques and risk management strategies.
Additionally, before integrating the stochastic oscillator into your crypto trading strategy, you should thoroughly backtest it on historical data and practice with paper trading or small positions to gain a better understanding of how it behaves in different market conditions.
Make an Altrady account, choose one or more exchanges, and enable the stochastic oscillator indicator to start analyzing crypto assets’ potential price range.