
Chapters
.svg)
Trend-Following Indicators
It has become a cliché but it’s actually true: successful crypto traders and investors stay on top of the market trends and movements. Technical analysis tools, particularly charts and indicators will give you enough information to identify cryptocurrency trends. Couple this information with a strong trading strategy and you can spot the signs better and anticipate future trends.

Here’s everything you need to know about trend-following indicators, which of these indicators are the most frequently used by novice traders, and their benefits
What are Trend-Following Indicators?
The main concept behind trend-following is that markets exhibit prolonged periods of upward or downward movement, so once a trend is in motion, it’s more likely that this will persist rather than reverse suddenly. A bullish trend is when prices go above the average whereas a bearish trend is when prices move under the average.
Trend followers believe riding the trend will bring them profitable trading opportunities by capturing gains while avoiding losses during periods of market noise or reversals.
Key characteristics of trend-following indicators:
- price as the primary input: these indicators rely mostly on price movements, specifically mathematical calculations applied to historical price data.
- objective and rule-based: trend-following strategies are rule-based; traders set specific criteria and indicators to determine when to enter, exit, or stay out of a trade.
The Most Common Trend-Following Indicators
Some of the most popular trend-following technical indicators are:
Moving Averages
Moving average indicators identify price trends in the market by averaging price data over a specified period. Moving averages simply show the direction and strength of the trend, without highlighting price fluctuations.
Traders use historical prices as a reference to figure out the direction of the trend. A rising moving average suggests that an asset or security is in an uptrend. Conversely, a falling moving average suggests that security is in a downtrend.
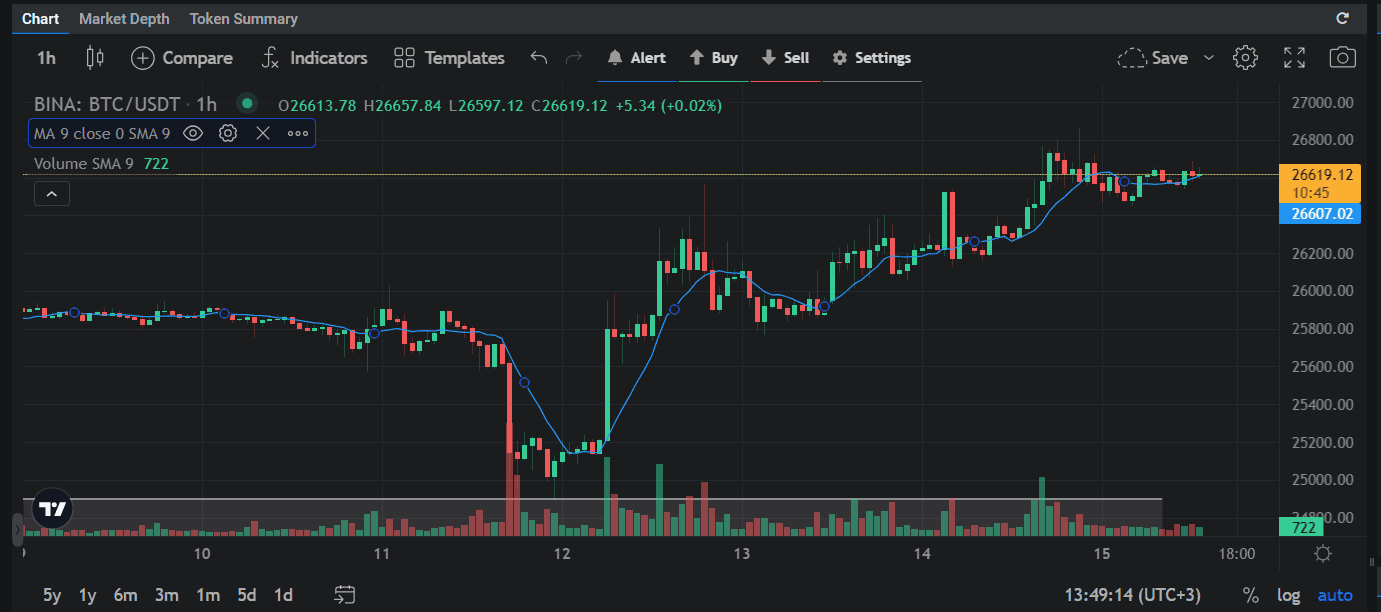
Moving Averages can be divided into mainly two types:
- Simple Moving Average (SMA) – averages price data over a set period, distributing each price equal weight.
Most novice traders use the 20-period SMA to catch on the overall trend direction and potential reversal points.
-
Exponential Moving Average (EMA) – gives more weight to recent prices, thus considered a reliable indicator for short-term analysis.
Novice traders often rely on the 12-period EMA to assess if prices are on an upward or downward trend.
Average Directional Index (ADX)
This is an indicator that measures the strength of the trend, whether the trend’s direction is going upward, downward, or sideways.
Based on ADX’s calculations, the indicator shows values that range from 0 to 100, with higher values (above 50) indicating stronger trends, and lower values (below 20), signaling weak trends.
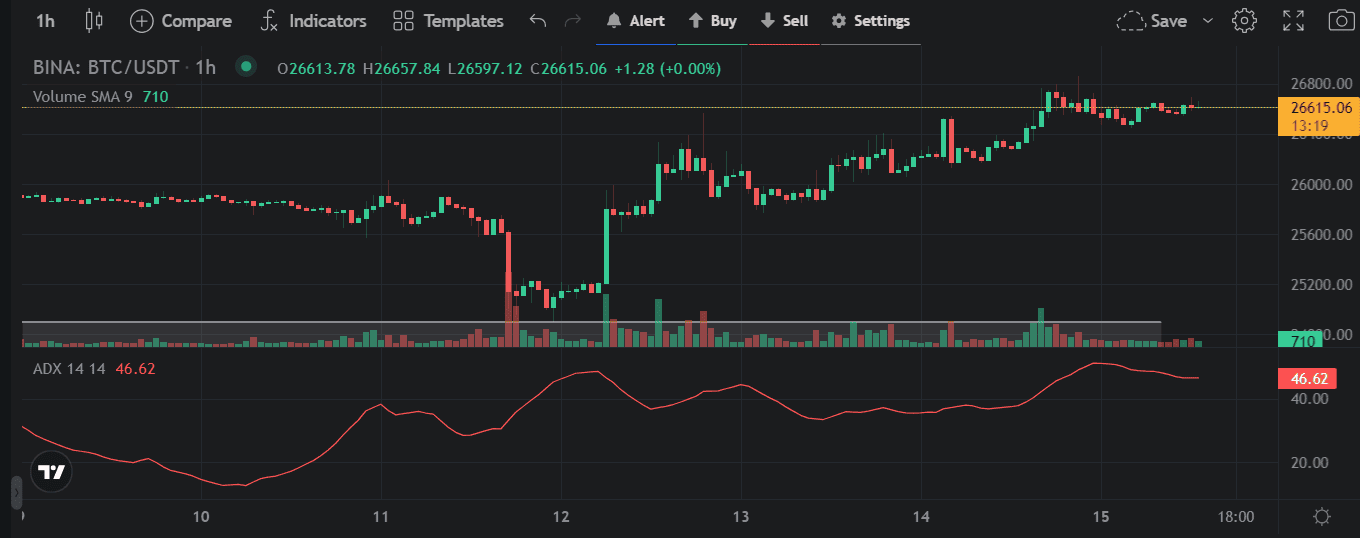
The ADX filters out weak or unstable trends, focusing on the strong and steady ones.
*Important note: the Average Directional Index doesn’t determine whether the trend is bullish or bearish; this indicator only measures the strength of the current trend.
Parabolic SAR
Parabolic SAR (Stop and Reverse) is a technical indicator used to identify possible trend reversals as it closely evaluates if prices rise or fall.
Its calculation involves starting with an initial value and using a trailing stop level (the shape of the parabolic curve), it updates this formula and will switch its direction if it notices a trend reversal.
On a trading chart, Parabolic SAR is represented by dots above or below the price action, showing a trend’s direction and momentum. Dots are displayed below the chart when prices go up, while dots above the chart translate into falling prices.
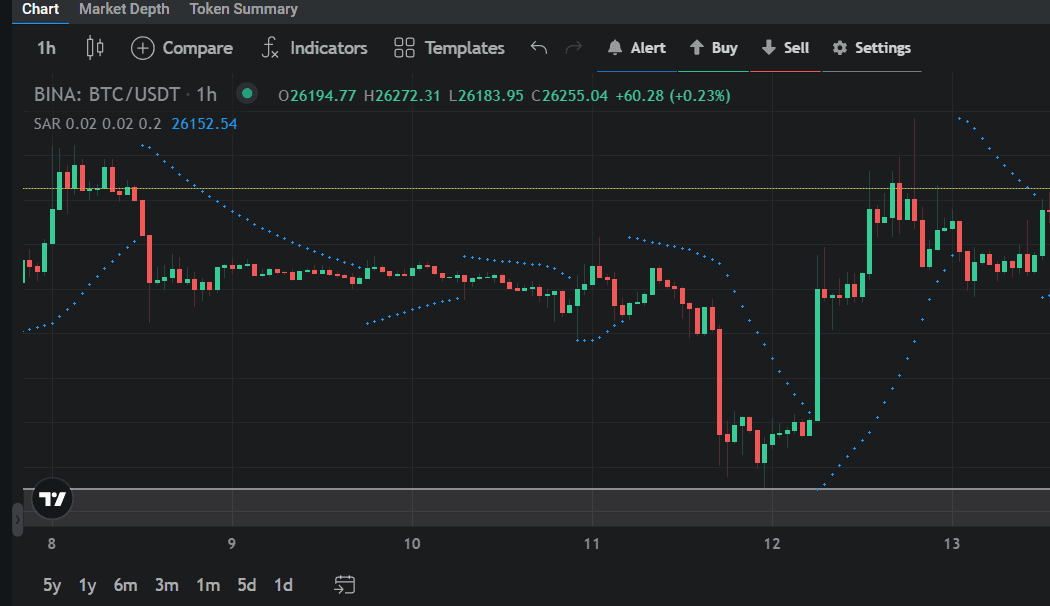
It’s recommended to use Parabolic SAR only in trending markets as these offer helpful entry and exit points.
Benefits of Trend Indicators
- Spot major trends
When the crypto market shows good momentum, trend traders seize the opportunity by adopting a long position – the very essence of the trend trading strategy. By adhering to this strategy, traders can take advantage of prevailing uptrends to maximize their gains. Some of these trends persist for extended periods, even years, so traders can strategically exploit continuous uptrends.
- Time efficiency
Traders don’t have to spend a lot of time to learn, understand, and use trend indicators. That’s why these indicators are particularly appealing to those who find their daily schedules constrained. Trend-following indicators are also suitable for those seeking to engage in overnight trading.
- Cost-effective transactions
Trend traders enjoy the advantage of minimal transaction costs, a stark contrast to the rapid transaction pace associated with day trading. With trend-following indicators, the strategy is slow-paced, involving identifying trends and following them for a longer time.

Conclusion
Understanding trend-following indicators and how they interact with market dynamics is crucial if you want to gain profit from crypto investments. Keep in mind that these indicators will help you spot trends, as well as determine entry and exit points.
Use trending indicators and increase your trading efficiency with Altrady platform. Altrady is ideal for beginners who want to start trading crypto as you can learn from easy-to-understand trading tutorials, enjoy the risk-reward calculator, and other valuable features.


