
Chapters
.svg)
Stochastic Oscillator RSI
Stochastic RSI, also known as StochRSI, is a technical indicator used in financial markets to analyze an asset's price momentum. It combines two popular indicators, the rsi'>Relative Strength Index (RSI) and the stochastic-trading-strategy'>Stochastic Oscillator, to provide traders with a more refined tool for identifying potential trend reversals and overbought/oversold conditions.
At Altrady, we've seen how effective the Stochastic RSI can be for identifying trading opportunities in the fast-paced cryptocurrency market. This guide provides a comprehensive overview of the StochRSI, with practical examples and insights for crypto traders.

What Stochastic RSI is it?
Stochastic RSI is a momentum oscillator that measures the relative position of the RSI within its range over a specific period. It is used to identify potential trend changes and to gauge whether an asset is overbought or oversold.
Why Combine RSI and Stochastic?
The Relative Strength Index (RSI) measures the speed of change in prices within a range of 0-100 to show overbought and oversold periods of assets. Its principal limitation is that it also may stay overbought or oversold for extended periods, leading to misleading signals, particularly during strong trends.
On the other side, the Stochastic Oscillator gauges the closing prices of an asset relative to its high and low over a determined period. This characteristic makes this momentum oscillator more sensitive to recent price changes than the RSI. As a consequence, the Stochastic can generate more false signals, especially during choppy markets.
Bringing both indicators together combines the best of each into a single “indicator of an indicator”, which is the Stochastic RSI, to take advantage of improved sensitivity while better addressing potential false signals.
What Stochastic RSI is based on?
Stochastic RSI is based on two underlying indicators:
- Relative Strength Index (RSI): This indicator measures the speed and change of price movements and ranges from 0 to 100. It identifies overbought conditions when RSI is above 70 and oversold conditions when RSI is below 30.
- Stochastic Oscillator: The Stochastic Oscillator compares the closing price of an asset to its price range over a specified period, typically 14 periods. It provides insights into the momentum of the price.
Formula
The formula of the StochRSI can be represented as follows:
- StochRSI = (RSI - Lowest Low RSI) / (Highest High RSI - Lowest Low RSI)
Where:
- RSI is the current relative strength value.
- Lowest Low RSI is the lowest RSI value over a look-back period.
- Highest HIgh RSI is the highest RSI value over the look-back period.
Then, the StochRSI is the result of dividing the subtraction between the RSI minus the lowest low RSI and the highest high RSI minus the lowest low RSI.
When to use Stochastic RSI?
Stochastic RSI is used in various ways by traders and investors:
- Identifying overbought and oversold conditions: When Stochastic RSI is above 70, it may suggest that the asset is overbought, signaling a potential price reversal. Conversely, when it's below 30, it may indicate oversold conditions, suggesting a potential buying opportunity.
- Finding divergence: Divergence between the Stochastic RSI and the price of an asset can signal a potential change in the current trend.
Bearish Divergence
This pattern occurs when the indicator acts in opposition to price action during upward movements or clear uptrends.
As soon as the StochRSI reaches the overbought area (70) but then starts pointing downwards while the asset price continues to rise (making a lower swing high), it is considered a bearish divergence, suggesting a potential change in direction from bullish to bearish.

Bearish divergence occurs when the price makes a higher high but the StochRSI makes a lower high around the overbought area.
Bullish Divergence
In this case, the pattern emerges when the indicator acts in opposition to price action during downside moves or clear downtrends.
As soon as the StochRSI reaches the oversold area (30) but then starts pointing upwards while the asset price continues to fall (making a higher swing low), it is considered a bullish divergence, suggesting a potential change in direction from bearish to bullish.

Bullish divergence occurs when the price makes a lower low but the StochRSI makes a higher low around the oversold area.
StochRSI During Volatility Periods
In highly volatile markets, StochRSI levels above 90 or below 10 might be more reliable signals. It is a good practice to adjust the parameters of the indicator to handle its sensitiveness and periods.
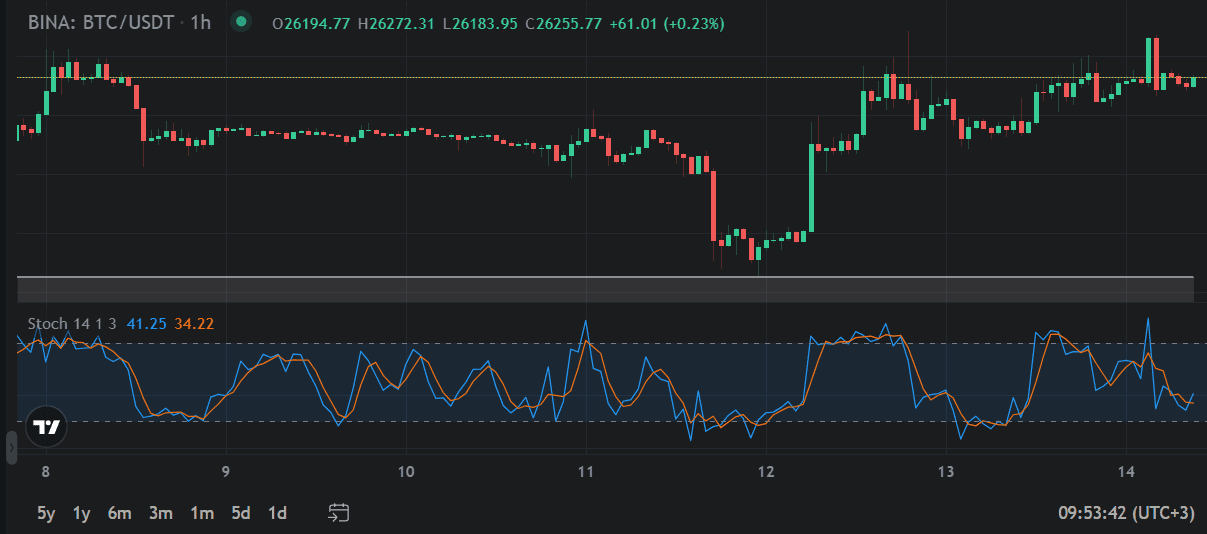
The default parameters have a setting of 14, 14, 3, 3 as follows:

This setting makes the indicator less sensitive so it remains oversold for a longer period while the price falls, as shown above.
Adjusting the parameters to a setting of 9, 9, 3, 3 gives slightly different results (in the same scenario), as follows:

This setting increases the indicator reaction, which can help traders spot more oversold and overbought situations and signals, like divergences or momentums, as shown above.
Both images above show a volatile scenario where the price moves up and down in a short period. The StochRSI signals vary according to the settings chosen. It is crucial to recall the following practices to avoid false signals:
- Confirming Overbought Conditions: Look for this condition above 70 and between 80 to 90 values. Reinforce the signal by spotting a pattern like a bearish engulfing candlestick.
- Confirming Oversold Conditions: Look for this condition below 30 and between 20/10 values. Reinforce the signal by spotting a pattern like the Hammer candlestick.

Using Stochastic RSI on Altrady with TradingView Charts for Buy and Sell Signals
- Access the Indicator: Open a Trading view chart on Altrady and click on the "Indicators" button at the top of the chart.
- Search for Stochastic RSI: In the search bar within the Indicators window, type "Stochastic RSI" and select it from the list of available indicators.
- Adjust Settings: A settings window for the Stochastic RSI indicator will appear. You can adjust the following parameters according to your trading strategy:
- Source: Choose the price source you want to use for the calculations (usually "Close" is selected).
- Length (RSI Period): Set the look-back period for the RSI component. Commonly used values are 14 or 9.
- Length (Stochastic Period): Set the look-back period for the Stochastic Oscillator component. This is typically set to a shorter value, such as 3.
- Overbought and Oversold Levels: Define the threshold levels for overbought (e.g., 70) and oversold (e.g., 30) conditions.
Identify Buy and Sell Signals
- Buy Signal: When the Stochastic RSI crosses above the oversold level (e.g., 20) and starts moving upward, it generates a potential buy signal. This suggests that the asset may be reversing from oversold conditions and entering an uptrend.
- Sell Signal: Conversely, when the Stochastic RSI crosses below the overbought level (e.g., 80) and starts moving downward, it generates a potential sell signal. This suggests that the asset may be reversing from overbought conditions and entering a downtrend.
- Confirmation: Using other technical and fundamental analysis tools to confirm signals generated by the Stochastic RSI is essential. Avoid relying solely on this indicator for trading decisions.

Conclusion
In conclusion, Stochastic RSI is a valuable ally in trading and investing. Its ability to uncover hidden signals within price data gives traders a powerful means to stay ahead of market trends, facilitating more informed and strategic decision-making. When used wisely and with other tools, Stochastic RSI can be a key asset in pursuing success in financial markets.


