
Chapters
.svg)
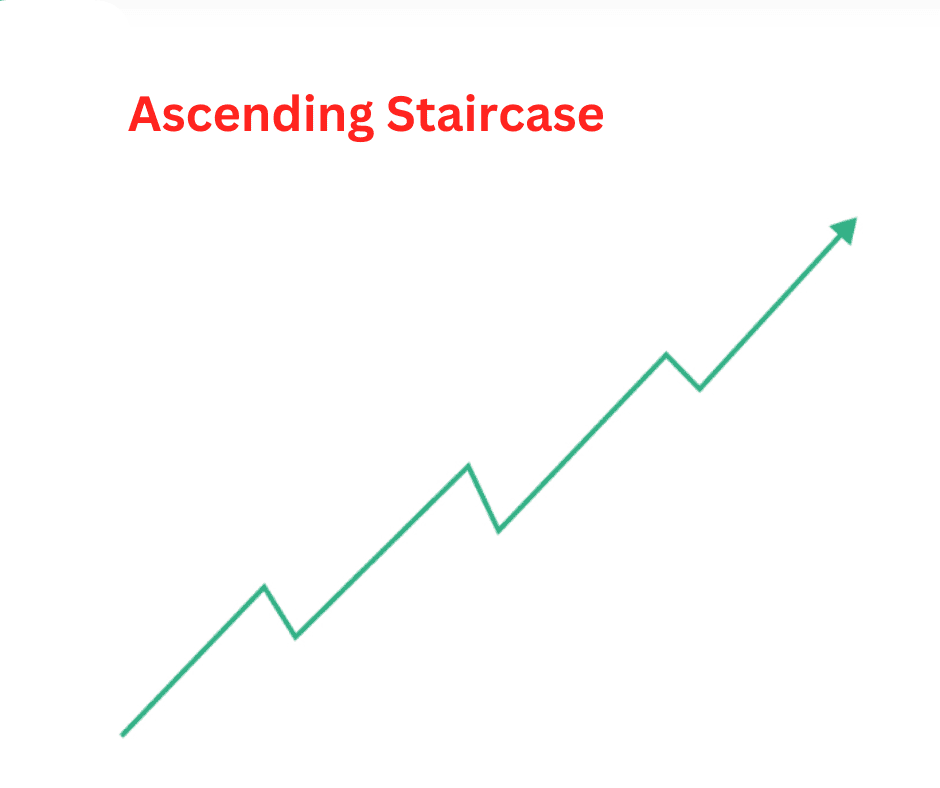
The Ascending Staircase in Crypto Trading
Crypto markets move in waves — surging, cooling off, then surging again. For traders who know how to read those waves, this volatility isn’t chaos; it’s opportunity. One of the most reliable bullish continuation setups in that rhythm is the ascending staircase pattern – a structure that reflects steady, controlled upward momentum.
If you’ve seen a price chart that climbs, pauses, consolidates, and then climbs again, that’s your staircase. Each “step” represents a consolidation phase where the market catches its breath before the next leg up. Recognizing this pattern early and trading it effectively can help you ride trends with confidence, rather than constantly chasing candles.
Read below to find out more.
What Is the Ascending Staircase Pattern?
The ascending staircase pattern (also called a step pattern or stair-step trend) is a bullish continuation setup where the price forms a series of higher highs and higher lows, separated by sideways consolidation zones.
Think of it as a price trend that climbs in steps instead of a diagonal line. Each leg up (the “riser”) represents a push from buyers, and each consolidation (the “tread”) is a pause where the market digests gains before moving higher.
In essence, it’s a visual reflection of healthy bullish momentum. Instead of an explosive, unsustainable rally, the ascending staircase shows controlled accumulation. Smart money is entering gradually, not in a panic — and that’s often the kind of buying that sustains a longer-term uptrend.
Here’s what it looks like conceptually:
- Impulse move up – Strong buying pressure lifts the price to a new high.
- Sideways or slightly downward consolidation – Price cools off, forming a mini range.
- Breakout from consolidation – Buyers regain control, pushing to a new high.
- Repeat – The process continues, forming higher steps on the chart.
You’ll often see this structure across different time frames: from intraday scalps on 5-minute charts to long-term swing setups on daily or weekly time frames.
How to Identify It
Spotting an ascending staircase is mostly about pattern recognition, but it’s not just about “higher highs and higher lows.” There are key components and characteristics that make a staircase pattern solid rather than random noise.
1. Clear Series of Higher Lows
This is the backbone of the structure. Each consolidation base (the tread) should form at a higher price than the previous one. This indicates buyers are stepping in earlier on each dip – a clear sign of strength.
2. Well-Defined Consolidation Zones
Between each rally leg, price often stalls in a sideways range or slightly descending channel. These zones are areas of accumulation, where new buyers are entering and weak hands are exiting.
3. Volume Confirmation
Volume usually spikes during each breakout and decreases during consolidation. That ebb and flow in volume shows that the market is cycling through bursts of buying energy followed by rest periods – a hallmark of an ascending staircase.
4. Support and Resistance Flips
Each time the price breaks out from a consolidation, that previous resistance area often becomes new support. When you see price respecting these newly formed supports, it confirms the staircase is structurally intact.
5. Momentum Indicators in Agreement
Indicators like RSI or MACD should generally show bullish conditions – higher lows in RSI, MACD lines trending upward, or positive histogram shifts. These confirm the pattern’s underlying strength.
If you’re scanning charts, the key visual is that steady “climb-rest-climb” rhythm. The market never runs away vertically; it steps up patiently. The best staircases look like they’re being built block by block.
Pros and Cons of the Spike Pattern
Pros
-
High-probability continuation setup
It often appears in established uptrends, meaning you’re trading with the market’s dominant direction. That naturally improves the odds of success. -
Clean entry opportunities
Each consolidation zone provides a clear breakout level. Traders can set alerts or limit orders and avoid impulsive entries. -
Defined risk levels
The bottom of each consolidation acts as a natural stop-loss level. This makes risk management straightforward. -
Scalable across time frames
The pattern repeats on multiple scales, whether you’re swing trading or scalping. That consistency makes it a flexible strategy.
Cons
-
Fake breakouts happen
Especially in volatile crypto markets, breakouts from consolidations can be traps. A candle wick above resistance doesn’t always mean real momentum. -
Late entry risk
If you identify the pattern too late, you might be buying near the top step, where momentum is fading. -
Choppy consolidations can shake you out
Consolidation zones aren’t always clean rectangles. Sometimes they’re messy, and stop-hunting can take out tight stops before the real breakout. -
Dependence on trend continuation
The pattern assumes the uptrend will continue. If the broader market sentiment flips bearish, the staircase can quickly turn into a cliff.
The key is to confirm context — don’t just see a few steps and assume it’s a staircase. Always cross-check with market structure and volume behavior.
How to Interpret the Ascending Staircase
The ascending staircase tells a psychological story. Each step represents a tug-of-war between bulls taking profits and new buyers entering the market.
When the price consolidates but refuses to fall below previous support levels, it signals that buyers are in control. Sellers can’t push it back down — they can only slow it.
Here’s how to interpret the action:
- Consolidation Phases: These are pauses for accumulation. If volume drops and price holds steady, buyers are regrouping for the next push.
- Breakouts: A breakout with volume confirms renewed bullish energy.
- Retests: When price pulls back to test the old resistance (now support), that’s your confirmation signal. If it holds, the staircase remains intact.
Essentially, you’re watching a series of successful handoffs from one group of buyers to the next, like a relay race moving steadily toward higher ground.
If you start seeing:
- Lower highs forming during consolidations
- Volume drying up completely
- Or supports breaking on retests
Then the staircase is likely breaking down. That’s your cue to tighten stops or take profits.
Trading Strategies Using This Pattern
Now, let’s translate theory into practice. There are several ways to trade the ascending staircase depending on your risk appetite and trading style.
1. Breakout Entry
How it works:
- Identify the consolidation range (the tread).
- Mark the resistance level (top of the range).
- Enter when price closes above that level with confirmation from volume.
- Set your stop-loss just below the range support.
Why it works:
Breakouts confirm that the next “step” is being formed. Entering on the breakout lets you ride the next impulse move without overexposure.
Pro tip: Wait for a candle close, not just a wick above resistance. Crypto markets love faking out eager traders.
2. Retest Entry
How it works:
- After the breakout, wait for the price to pull back to the old resistance (which should now act as support).
- Enter when it bounces from that support with clear bullish confirmation.
- Stop-loss goes slightly below that support level.
Why it works:
Retests offer better risk-to-reward ratios. You’re buying the dip within the trend, not chasing green candles.
Pro tip: Combine this setup with RSI or MACD divergence to confirm strength before entering.
3. Staircase Swing Strategy
How it works:
- Use higher time frames (4H, daily).
- Identify multiple staircase steps — ideally at least three.
- Enter after confirmation of the third step breakout and ride the trend until a lower low forms.
- Trail your stop-loss under each new higher low as the staircase builds.
Why it works:
This method captures the macro structure of the trend. It filters out noise and focuses on the broader upward momentum.
Pro tip: Combine it with moving averages (like the 20EMA) — in strong staircases, the price tends to respect that line as dynamic support.
4. Partial Profit Laddering
Since the staircase is a progressive trend, you can scale out profits step by step.
Sell a portion after each leg up.
Re-enter partial positions on retests.
This compounding method keeps you engaged in the move while locking in profits consistently.
Real-World Crypto Examples
Bitcoin’s 2020–2021 Bull Run
BTC’s climb from ~$10,000 to $60,000 was one massive ascending staircase on the weekly chart. Each surge to a new high was followed by multi-week consolidations between key levels — $12K, $20K, $30K, $40K. Traders who recognized that pattern early could simply buy each breakout and trail stops upward.
Solana’s 2023 Recovery
After bottoming around $10, SOL formed a textbook staircase on the daily chart — breaking out, consolidating near $25, then repeating at $35 and $45. Each consolidation zone became a platform for the next rally, with clean retests providing multiple entry points.
These examples highlight why staircase patterns are favorites among swing traders — they offer structured setups with logical entries and exits.
Final Thoughts
The ascending staircase pattern is one of the cleanest ways to visualize a strong, sustainable uptrend. It’s not flashy but rather disciplined. And in crypto, where hype often overshadows structure, that discipline can be a trader’s secret weapon.
When you spot an ascending staircase, you’re essentially watching the market grow in organized steps – a reflection of steady buying pressure and controlled optimism.
Master it, and you’ll stop chasing pumps and start walking the stairs to consistent profits.


