
Chapters
.svg)
The Descending Staircase in Crypto Trading
You already know that crypto doesn’t just rise, but it falls hard, too. But not every drop is a crash. Sometimes, prices bleed slowly, step by step, forming a structure that tells a story of controlled selling pressure. That structure is known as the descending staircase pattern.
If you’ve ever seen a chart where price keeps sliding lower, then pausing, then sliding again, you’ve likely spotted it. It’s the bearish twin of the ascending staircase – a pattern that reflects sustained selling with small pauses for breath.
Understanding this formation can help you short more effectively, protect profits, and avoid trying to “catch the bottom” too early.
Find out more about this pattern formation.
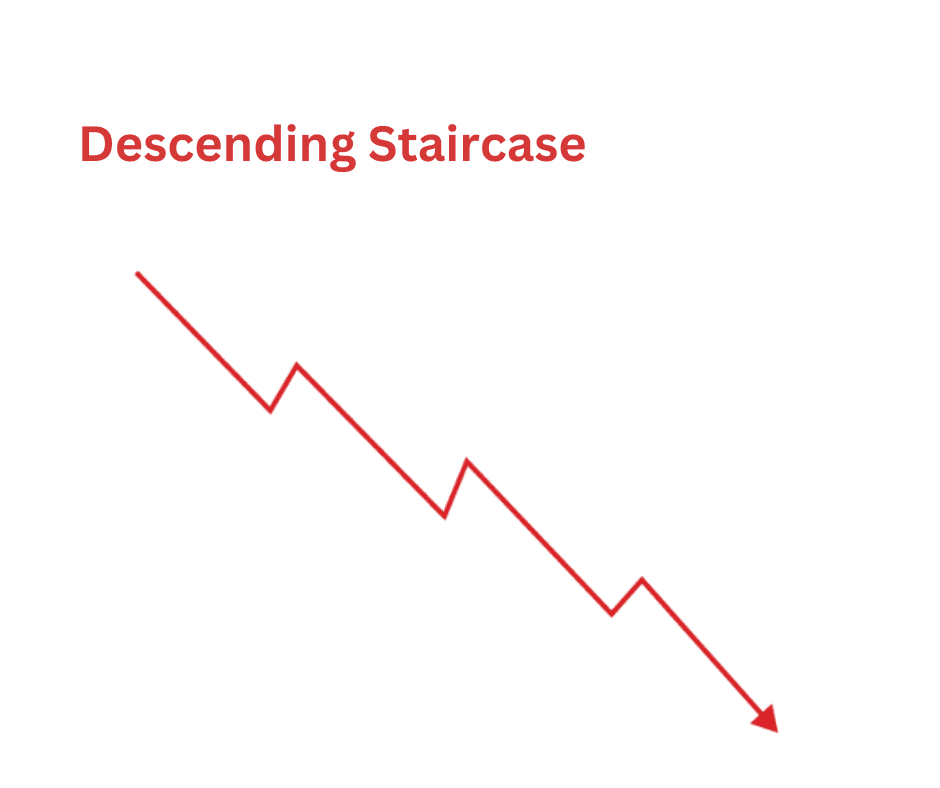
What Is the Descending Staircase Pattern?
The descending staircase pattern is a bearish continuation setup where price moves downward in stages, forming lower highs and lower lows separated by short periods of sideways consolidation.
Picture it like a staircase tilted downward. Each “step” is a consolidation or pause after a sell-off, followed by another breakdown to a new low. It shows that sellers are in control, but instead of a panic crash, they’re pushing the market down gradually and systematically.
It’s a visual representation of steady distribution, where traders offload positions, rallies are weak, and buyers can’t build momentum. Every attempt to bounce gets smothered by sellers waiting at lower levels.
The pattern typically plays out like this:
- Impulse move down – A sharp drop kicks off the structure.
- Sideways or slightly upward consolidation – Price stabilizes, forming a mini range or bear flag.
- Breakdown from consolidation – Sellers step back in, pushing price to new lows.
- Repeat – The cycle continues, forming a staircase that trends down over time.
You’ll see it across all time frames — from five-minute scalp setups on BTC to month-long declines in altcoins after hype cycles fade.
How to Identify It
Spotting the descending staircase is about recognizing that repeating pattern of lower highs and consolidations. But to trade it effectively, you need to understand its anatomy and confirm its legitimacy.
Here are the main components and signs to look for:
1. Lower Highs and Lower Lows
Each rally fails sooner than the last. This is the backbone of the descending staircase. The market shows that buyers are getting weaker — each bounce attracts new sellers, not buyers.
2. Consolidation Phases (The “Steps”)
After each sell-off, the price tends to range sideways or drift slightly upward in a tight band. These phases are traps for optimistic traders who think the dip is done — but in reality, they’re areas where sellers reload.
3. Volume Behavior
Volume typically spikes during the downward impulses and fades during consolidation. That pattern — heavy selling, light buying — is what gives the staircase its controlled descent shape.
4. Failed Support Retests
Each consolidation range often breaks down, and when price tries to retest that old support, it now acts as resistance. This “support turns resistance” flip confirms the staircase is intact.
5. Bearish Momentum Indicators
Momentum tools like RSI or MACD usually confirm the structure. RSI tends to make lower highs, while MACD stays below the zero line or shows weak bullish crossovers that fail quickly.
If you can draw a descending channel that fits multiple consolidation zones and breakdowns, chances are you’re looking at a descending staircase.
Pros and Cons of the Spike Pattern
No pattern is perfect, and the descending staircase comes with its own strengths and risks. Understanding both sides helps you trade it with a level head instead of emotion.
Pros
-
Predictable continuation setup
Once the pattern establishes itself, it tends to repeat until momentum shifts. That makes it great for short-side setups or cautious re-entry timing for longs. -
Clear risk levels
Each consolidation range gives you a defined resistance area — a natural place to put your stop-loss if shorting. -
High R:R potential
Since breakdowns often extend sharply, the risk-to-reward ratio can be excellent, especially if you enter near the top of a consolidation. -
Works on all time frames
You’ll find descending staircases on 15-minute altcoin charts, 4-hour BTC charts, and even multi-week bear markets. It’s scalable.
Cons
-
False breakdowns and whipsaws
Crypto loves to fake out traders. A quick dip below support can reverse sharply, catching overconfident shorts. -
Choppy or uneven steps
Not every consolidation is clean. Some are messy, and if you misjudge where one step ends, you might get shaken out early. -
Late entries can be dangerous
Entering near the bottom step of an extended staircase often means shorting into oversold territory — where bounces can be violent. -
Requires Patience
The pattern develops slowly. Impatient traders might enter too early or exit before the real move plays out.
In short: the descending staircase offers structure and clarity, but you still have to time it right. It rewards discipline and punishes guesswork.
How to Interpret the Descending Staircase
The descending staircase tells a clear psychological story; it’s the market’s way of saying: “Bulls are trying, but they’re getting crushed every time.”
Each consolidation phase represents a tug-of-war between bargain hunters and sellers. But in this tug-of-war, sellers always win, because:
- Rallies fail to break previous highs.
- Support levels get broken and then flipped to resistance.
- Volume shows conviction during drops and apathy during bounces.
When you see that rhythm (drop, pause, weak rally, drop again), it’s a textbook sign of controlled distribution. Smart money is exiting positions slowly, not panicking, while retail traders keep hoping for a reversal that never comes (until it’s too late).
Here’s what the phases tell you:
- Impulse Down: Strong selling pressure — often news-driven or liquidation-heavy.
- Consolidation: Sellers cool off; buyers step in, hoping for a rebound.
- Breakdown: Sellers regain control; support breaks; another wave of stops triggers.
When the pattern continues, it becomes a feedback loop: buyers keep losing confidence, and each small rally becomes a new shorting opportunity.
However, the moment the pattern breaks — when price stops making new lows and starts building higher lows — that’s your early signal that the trend may be shifting. Recognizing that transition is key for timing reversals or taking profit on shorts.
Trading Strategies Using This Pattern
Once you’ve spotted the pattern, the next step is knowing how to trade it effectively. There are a few core strategies traders use, depending on their style and risk tolerance.
1. The Breakdown Entry
How it works:
- Identify a consolidation range (the “step”).
- Mark the key support level.
- Enter a short position when price closes below that support with increased volume.
- Place your stop-loss just above the top of the range.
Why it works:
Breakdowns confirm the next step of the staircase is forming. You’re entering in the direction of momentum, not against it.
Pro tip: Wait for confirmation — a strong close below support, not just a wick. Crypto’s fakeouts can punish premature shorts.
2. The Retest Entry
How it works:
- After the breakdown, wait for price to retest the broken support (now resistance).
- Enter your short on rejection from that level, confirmed by a bearish candle or momentum indicator.
- Place your stop-loss slightly above the resistance zone.
Why it works:
Retests often offer the best risk-to-reward setups — they let you short from higher prices with tighter stops.
Pro tip: Look for low-volume pullbacks during retests — they often precede another leg down.
3. The Swing Staircase Strategy
How it works:
- Identify a larger pattern with multiple steps forming on higher timeframes.
- Enter on confirmed breakdowns and hold until the next consolidation forms.
- Move your stop-loss lower as new steps develop.
Why it works:
This approach captures broader downtrend moves instead of chasing every micro-breakdown. It’s great for swing traders riding medium-term bearish phases.
Pro tip: Combine it with moving averages (like the 20 EMA or 50 EMA). In strong descending staircases, the price tends to stay below these lines consistently.
4. Scaling Out and Covering Shorts
Descending staircases can last a long time, but you don’t want to get greedy.
Take partial profits after each major leg down.
Re-add on retests if the pattern continues.
Always tighten stops when volatility spikes or market sentiment starts to shift.
This keeps your capital protected while still participating in the broader move.
Real-World Crypto Examples
Bitcoin’s 2018 Bear Market
BTC’s fall from $6,000 to $3,000 was a textbook descending staircase on the weekly chart. Price would dump, consolidate for weeks, fail to break resistance, then dump again. Traders who recognized the pattern shorted or stayed out instead of buying every “dip.”
Altcoin Downtrends in 2022
After the Luna collapse, many altcoins like AVAX, ADA, and DOT formed beautiful (if painful) descending staircases. Each rally was sold off, and support levels kept flipping into resistance. Traders using the staircase model could identify breakdowns early and avoid getting trapped in false bottoms.
Ethereum 2021 Corrections
Even in bull markets, ETH’s intraday pullbacks often formed descending staircases on lower time frames, giving short-term traders multiple short and re-entry opportunities during volatile sessions.
Final Thoughts
The ascending staircase pattern is one of the cleanest ways to visualize a strong, sustainable uptrend. It’s not flashy but rather disciplined. And in crypto, where hype often overshadows structure, that discipline can be a trader’s secret weapon.
When you spot an ascending staircase, you’re essentially watching the market grow in organized steps – a reflection of steady buying pressure and controlled optimism.
Master it, and you’ll stop chasing pumps and start walking the stairs to consistent profits.


