
Chapters
.svg)
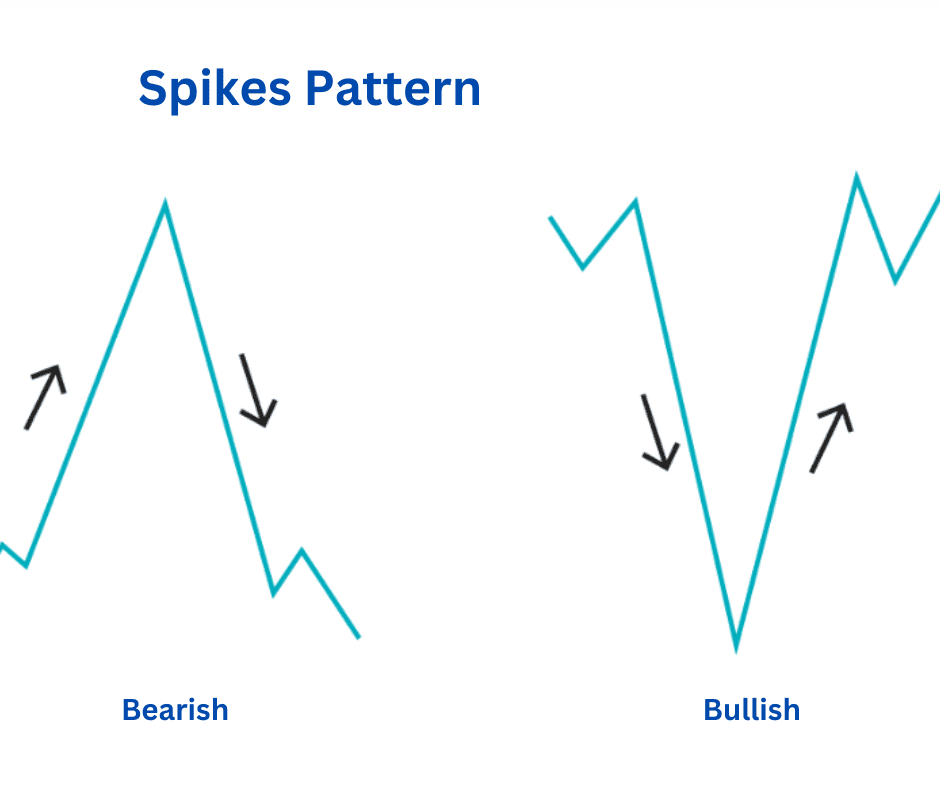
The Spike Pattern in Crypto Trading
You’ve probably seen this: price shoots up or down in one violent move, then just as quickly flips the other way. That sudden surge or crash looks like a “spike” stabbing into your chart. For many traders, it feels like chaos: random, impossible to predict. But in reality, these spikes often follow a certain rhythm, and if you learn to recognize the spike pattern, you can use it to your advantage.
Let’s break it down: what the spike pattern is, how to spot it, what makes it useful (and dangerous), and how traders actually use it in the wild.
What Is the Spike Pattern?
A spike pattern is a type of reversal formation that happens when price makes a sudden, extreme move in one direction (the spike) and then immediately reverses. It’s not a slow U-turn – it’s a whiplash reversal.
In simple terms, the market overshoots. Buyers or sellers push price too far, too fast, and then the other side slams back.
Spikes can happen on both ends:
- Spike bottom: A sharp dump followed by a quick rebound.
- Spike top: A vertical pump followed by a steep sell-off.
They’re common in crypto because the market is heavily driven by liquidity grabs, liquidation cascades, and emotional trading. Unlike stocks or forex, crypto loves extremes.
How to Recognize It
The spike pattern can look messy in real time, but it has some clear features.
1. The Spike Move
This is the defining part. Price shoots in one direction (down or up) in a single tall candle (sometimes two). This candle dwarfs the others around it.
On a spike top, you’ll see a massive green candle pushing to new highs.
On a spike bottom, you’ll see a huge red candle slicing to new lows.
2. The Reversal Candle(s)
Immediately after the spike, the next candle (or two) reverses hard in the opposite direction.
After a spike top, a fat red candle eats back into the green one.
After a spike bottom, a strong green candle reclaims lost ground.
3. Volume Surge
Spikes almost always come with massive volume – liquidations firing, breakout traders piling in, or whales dumping/accumulating. If you don’t see unusual volume, it’s probably not a true spike.
4. Context
The pattern works best at extremes: near key resistance (for tops), or near major support (for bottoms). If you see a spike forming in the middle of a range, it’s just noise.
Pros and Cons of the Spike Pattern
Pros
- Clear signal: When it happens, it’s loud and obvious. The spike candle stands out.
- Excellent risk-to-reward: You can often place tight stops just beyond the spike, while targeting much larger reversals.
- Works across time frames: Whether you’re scalping on the 1-minute chart or swing trading the daily, spikes show up everywhere.
- Matches crypto’s DNA: Crypto is volatile and liquidity-driven, making spikes more frequent compared to traditional markets.
Cons
- High-risk, high-stress: If you’re wrong, you can get wiped out fast. Entering too early during the spike is a common mistake.
- Hard to trade in real time: By the time you recognize the spike, price may already be snapping back.
- Prone to fakeouts: Not every big candle is a real spike. Sometimes what looks like a reversal is just a pause before continuation.
- Requires quick decision-making: Spikes don’t wait. You need rules in place to act fast.
How to Interpret the Spike
Spikes tell a story about market psychology.
- Spike Top: Buyers FOMO in at the highs, shorts get liquidated, and then boom! The demand runs out. Whales dump into that euphoria, and price collapses. It’s a picture of greed followed by reality.
- Spike Bottom: Sellers panic, longs get liquidated, and everyone assumes the floor just fell out. But then, with supply exhausted, smart buyers scoop up cheap coins, flipping the market back up. That’s fear giving way to opportunity.
The interpretation depends on one thing: exhaustion. The spike signals that one side (buyers or sellers) just threw everything they had at the market, and now the balance of power is shifting.
Trading Strategies Using The Spike Pattern
1. Classic Reversal Trade
- Entry: Wait for the spike candle to finish, then enter on the first reversal candle in the opposite direction.
- Stop-loss: Place it just beyond the extreme of the spike.
- Target: Previous support/resistance or a 2–3x risk-to-reward ratio.
This is the bread-and-butter spike trade. For example, if Bitcoin prints a $2,000 red spike candle to $25,000 and immediately rebounds, you enter long after the first green candle, stop just under $25,000.
2. Fade the FOMO/Panic
This strategy plays into trader psychology.
- If you notice a Spike Top: Go short into the euphoric pump.
- When you see a Spike Bottom: Buy into the panic dump.
But you must wait for confirmation (the reversal candle). Fading too early is how accounts get blown up.
3. Volume Confirmation Play
If the spike move is followed by a reversal candle with even higher volume, that’s gold.
- Entry: Enter on that confirmation.
- Stop-loss: Still beyond the spike extreme.
- Target: Let it ride until momentum cools (e.g., RSI or MACD shows slowdown).
4. Trap Hunter Strategy
Spikes often trap breakout traders:
- A spike top sucks in breakout longs, then reverses and liquidates them.
- A spike bottom traps breakout shorts, then squeezes them.
If you spot this happening at a key level, you can trade against the breakout crowd.
- Entry: Enter in the opposite direction of the spike move after confirmation.
- Stop-loss: Beyond the spike high/low.
- Target: The midpoint of the prior range or the opposite side of it.
5. Scalping Spikes
On smaller time frames, spikes create quick scalping opportunities.
- Entry: After the spike candle, enter on the reversal wick.
- Stop-loss: Tight, just beyond the wick.
- Target: 1–2x your risk, quick in-and-out.
This works best during high-volatility sessions, like when big economic news drops or when a major altcoin is pumping.
Hypothetical Example
Imagine Ethereum is trading at $1,600. Suddenly, in one 15-minute candle, it dumps to $1,500 on huge liquidation volume. Panic is everywhere, Twitter’s screaming “ETH to $1,200.” But the next 15-minute candle bounces hard, closing back above $1,560.
That’s a spike bottom.
- Entry: You go long at $1,560.
- Stop-loss: Just under $1,495 (the spike low).
- Target: First at $1,650 (recent support turned resistance), then let the rest ride if momentum continues.
- Risking $65 (entry to stop) for a potential $90+ reward is a solid setup.
Final Thoughts
The spike pattern isn’t for the faint of heart. It’s fast, brutal, and loaded with emotion. But that’s exactly why it works: it thrives on overreaction. In a market like crypto, where extremes are the norm, spikes happen more often than traders realize.
Key rules to trade them effectively:
- Respect context (look for spikes at key levels).
- Wait for confirmation (don’t jump in mid-spike).
- Keep your stops tight (always just beyond the extreme).
- Be ready to act fast (spikes don’t linger).
At the end of the day, spike patterns aren’t just random chaos; they’re the market’s way of flushing out weak hands and setting the stage for the next move. If you can train your eye to spot them and your discipline to trade them, you’ll start seeing opportunity where most traders only see noise.


