
Chapters
.svg)
The Megaphone Pattern in Crypto Trading
When you first see a megaphone pattern on a crypto chart, it looks like the market’s yelling at you, and in a way, it is. This loud, expanding formation tells you volatility’s cranking up, and traders can’t agree on direction. It’s a tug-of-war that keeps stretching wider until one side finally snaps.
Learn more about what the megaphone pattern actually is, how to spot it, what makes it tick, when it works (and when it doesn’t), and how to trade it smartly instead of getting caught in its chaos.
What Is the Megaphone Pattern?
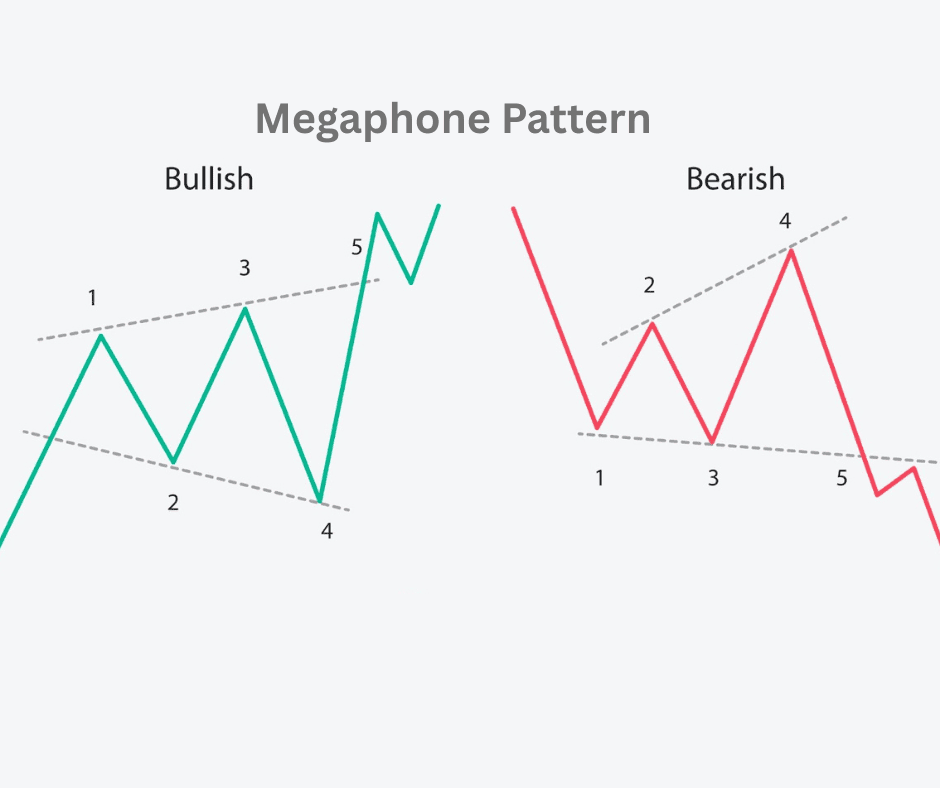
The megaphone pattern, also called a broadening formation, looks exactly like its name — a cone or loudspeaker shape that opens up over time. Prices swing higher and lower in expanding waves, forming higher highs and lower lows.
You’ll usually see it when the market’s getting increasingly volatile and uncertain. Unlike tighter consolidation patterns like triangles or flags, the megaphone pattern screams instability. It shows up when traders are fighting hard — bulls pump it up, bears slam it down, and neither side wins right away.
In traditional technical analysis, the megaphone pattern often appears near the top of a market cycle, hinting that the rally’s running out of steam. But in crypto, where chaos is standard, it can appear anywhere — both as a reversal pattern and sometimes as a continuation pattern.
The key idea: when you see those widening swings, it’s a signal that momentum is unstable, and big moves could be coming.
How to Identify It
To spot a megaphone pattern, zoom out a bit on your chart. It usually takes shape over several swings and isn’t always obvious up close. Here’s what you’re looking for:
1. Expanding Range
Each successive high is higher than the last, and each successive low is lower than the last. Draw trend lines across the tops and bottoms — you’ll see them diverge like a mouth opening wide.
2. At Least 5 Touchpoints
For a proper pattern, you want at least two highs and two lows, ideally five total touches between the upper and lower boundaries. It’s not official until both lines get tested more than once.
3. Increasing Volatility
Notice how each swing gets wilder. This is the hallmark of the megaphone — a market losing its grip, where traders keep overreacting in both directions.
4. Context Matters
Check where it’s forming. If the megaphone shows up after a strong uptrend, it could be a distribution pattern, signaling exhaustion and a possible reversal. If it appears after a downtrend, it might be accumulation, with buyers slowly overpowering sellers.
The Components of the Megaphone Pattern
Breaking it down helps you read what’s happening under the surface:
- Upper trend line (resistance): Connects the higher highs. This line represents overconfidence — where bulls get too aggressive before sellers smack them down.
- Lower trend line (support): Connects the lower lows. This marks panic points — where fear spikes before dip buyers rush in.
- Volume: Often increases with each swing, confirming that volatility is truly expanding, not just drifting.
- Breakout point: Eventually, price breaks out beyond one of the trend lines, which signals that one side has finally taken control.
Pros and Cons of the Megaphone Pattern
Pros
- Early Warning Signal: It can hint that a strong move — up or down — is brewing.
- Volatility-Friendly: For short-term traders, it’s full of opportunities. Each swing offers potential entries and exits.
- Clear Structure: Once identified, it gives obvious boundaries for stop losses and targets.
Cons
- High Whipsaw Risk: Since volatility’s expanding, false breakouts are common. You can get faked out easily.
- Hard to Time: The pattern doesn’t tell you exactly when the final breakout will come. It can drag on longer than expected.
- Emotionally Draining: Watching those violent swings can mess with your psychology — it’s not a pattern for the faint-hearted.
In short: the megaphone pattern gives opportunities but demands discipline. Without a plan, you’ll get chopped to pieces.
How to Interpret the Megaphone Pattern
Here’s the crucial part: understanding what the market’s really saying when this pattern appears.
The expanding swings show disagreement. Bulls and bears are both active, but neither side’s in full control. Momentum is unstable. The bigger swings reflect rising emotional energy — fear and greed are amplifying. A breakout ends the chaos. Eventually, the market picks a direction. The side that breaks the boundary tends to dominate the next big move.
Now, depending on where the breakout happens, you can interpret it differently:
- Breakout above resistance: Bullish signal. The market’s done shaking out weak hands and is ready to trend higher.
- Breakdown below support: Bearish signal. The market’s capitulating, and sellers are taking charge.
Volume confirmation helps a lot here: if the breakout happens on high volume, it’s more likely to stick.
Trading Strategies Using This Pattern
Let’s get into the juicy part: how to trade it. These are practical strategies crypto traders use to play the megaphone — whether you’re scalping, swing trading, or holding positions longer term.
1. The Breakout Play
This is the classic approach. Wait for the pattern to complete, then ride the move once price breaks out of the megaphone structure.
How to do it:
- Draw the upper and lower trend lines carefully.
- Wait for a decisive breakout (a strong candle that closes beyond the line).
- Confirm with volume — if the breakout happens with thin volume, skip it.
- Place your stop just inside the pattern, near the last swing point.
- Target at least the same distance as the pattern’s height (the widest part of the megaphone).
Example:
Say BTC forms a megaphone from $62,000 (high) to $54,000 (low), widening over time. If price breaks above $63,000 with strong volume, a trader might target $71,000 (the 9k range added to the breakout point).
This works best in markets with clear direction and strong momentum — think early bull markets or post-news volatility spikes.
2. The Range Trader’s Game
If you spot the megaphone early and the market’s still bouncing between support and resistance, you can trade the swings inside it.
How to do it:
- Go long near the lower trend line (support).
- Go short near the upper trend line (resistance).
- Use tight stops — this strategy relies on catching reversals, not breakouts.
- Take profits fast; don’t get greedy.
Tip: This approach works better on shorter timeframes (1H, 4H, daily), especially when volume confirms each reversal. But it’s risky — one strong breakout can invalidate your setup in seconds.
3. The Divergence Setup
Combine the megaphone with an indicator like RSI or MACD. You’re looking for divergence — when the indicator doesn’t confirm the expanding highs or lows.
Example:
Price makes higher highs, but RSI makes lower highs. That’s a bearish divergence — it hints the final breakout may be downward.
Conversely, lower lows in price but higher lows in RSI could signal the opposite.
This setup helps filter out false signals and gives you more confidence in predicting breakout direction.
4. Volume Break Confirmation
Volume often spikes at the final breakout. Watching for this can give you a huge edge.
When the price breaks the boundary line:
- Rising volume = real breakout (trend likely to continue)
- Falling volume = fakeout risk (price might snap back into the range)
For crypto, where fakeouts are common, this distinction can make or break your trade.
5. Multi-Timeframe Strategy
Megaphone patterns can look different depending on your zoom level. A structure that looks chaotic on the 1H chart might reveal a clean megaphone on the daily.
So:
- Use higher timeframes to confirm the structure.
- Use lower timeframes to fine-tune your entries.
This approach helps you trade with the bigger picture in mind — and reduces the odds of misreading random noise as a valid pattern.
Final Thoughts
The megaphone pattern is one of those formations that demands respect. It’s volatile, emotional, and messy — kind of like the crypto market itself.
If you can read it right, though, it gives you valuable insight into crowd psychology. It shows when fear and greed are spiraling out of control — and that’s often where big money is made (or lost).
Key takeaways:
- Look for higher highs and lower lows forming a widening cone.
- Watch for volume expansion to confirm volatility.
- Trade breakouts or swings, but not both — pick a side and stick to it.
- Always use tight stops, because this pattern can reverse violently.
- Combine it with indicators (like RSI or MACD) for better confirmation.
Ultimately, the megaphone pattern isn’t magic — it’s a lens. It helps you see when the market’s shouting louder than usual, and whether it’s signaling a final blow-off or the start of something new.
If you can stay patient, ignore the noise, and wait for clean setups, the megaphone can turn chaos into opportunity. Just don’t forget your earplugs because when this pattern hits, the market’s volume knob is cranked all the way up.


