
Chapters
.svg)
The V Pattern in Crypto Trading
You’ve seen it happen: price crashes hard, bottoms out, then rockets straight back up like nothing happened. That fast, violent rebound forms what traders call a V pattern, one of the cleanest (and most emotional) reversal patterns in all of trading.
The V pattern is dramatic, powerful, and can offer some of the best risk/reward setups in crypto; if you know how to identify and trade it properly.
Let’s see how it works, how to spot it early, its strengths and weaknesses, and some practical trading strategies built around it.
What Is the V Pattern
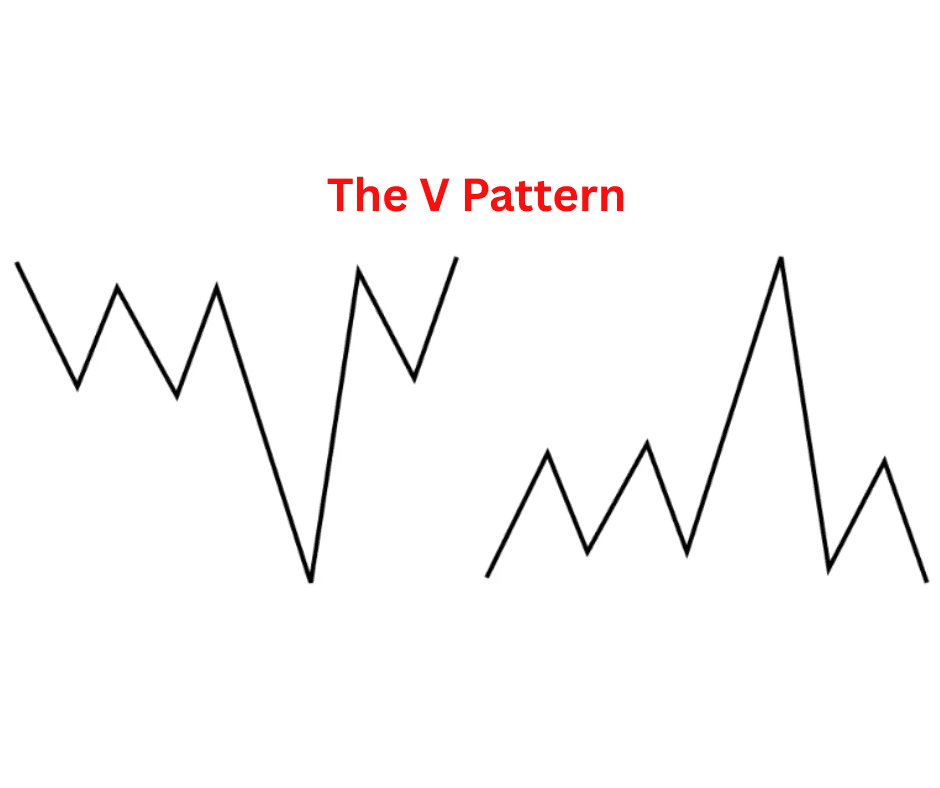
The V pattern, also called a V-shaped reversal, is exactly what it sounds like: a sharp price decline followed by an equally sharp rebound, forming a “V” shape on the chart.
It represents a complete shift in market sentiment, from panic-selling to aggressive buying, often triggered by oversold conditions, short squeezes, or sudden changes in fundamentals or news.
In crypto, where volatility is the norm, V patterns pop up more often than in traditional markets. Bitcoin crashes 20% in a day, bottoms out, then rebounds 25% the next week? That’s textbook V pattern behavior.
The key characteristic is speed. Unlike rounded bottoms or slow reversals, V patterns are fast and steep, meaning traders have to be alert to catch them.
How to Identify It and Its Components
Recognizing a true V pattern requires more than just seeing a bounce. The shape alone can fool you as it’s the price action behavior inside that matters.
Here’s what to look for:
1. A Sharp, Vertical Decline
The first leg of the V is the breakdown: an intense drop driven by fear, liquidations, or negative news.
You’ll usually see:
- Large red candles
- High volume (panic selling)
- Price slicing through support levels
- RSI deep in oversold territory
This leg often ends with a “capitulation” move – the last big flush where sellers dump at any price.
2. A Clean, Violent Reversal
After that capitulation, price suddenly flips. Buyers step in aggressively, shorts start covering, and the market rips upward almost as fast as it fell.
Key signs include:
- A big bullish candle (often engulfing several previous reds)
- Volume spike on the reversal
- RSI snapping upward from oversold zones
- Breaks of short-term resistance lines
This reversal leg forms the right side of the V – the confirmation that sentiment has turned on a dime.
3. The Center Point (The “Pivot”)
This is the lowest point: the bottom of the V, where buyers overpower sellers. It’s often a key support zone, previous low, or a Fibonacci retracement level (like 61.8% or 78.6%).
Traders sometimes wait for a retest of this pivot before entering, to confirm the reversal has real strength.
4. Volume Profile
Volume plays a big role in confirming a V pattern.
The left side (decline) usually has rising sell volume.
The right side (recovery) should show even stronger buy volume.
Without that shift in volume, the V might be a trap or just a temporary bounce.
Pros and Cons of the V Pattern
Pros
-
Early Trend Reversal Signal:
It often marks the end of a downtrend and the start of a new bullish phase — getting in early can be incredibly profitable. -
Strong Momentum:
V patterns usually produce sharp price runs after reversal, making them great for swing trades. -
Clear Invalidation Point:
The pivot low acts as a logical stop-loss zone. If price breaks below it again, the pattern’s invalid. -
Works Across Timeframes:
You’ll find V patterns on 1-hour charts, daily charts, even weeklies. The logic stays the same.
Cons
-
Hard to Catch in Real Time:
The reversal is fast — blink and you miss it. Many traders only spot the V after it’s formed. -
False V’s (Fakeouts):
Some “V” bounces are just dead cat bounces – temporary recoveries before another leg down. -
Emotionally Challenging:
Buying when the market looks dead takes guts. Most traders freeze during the panic leg. -
Needs Volume Confirmation:
Without strong reversal volume, the pattern can collapse quickly.
How to Interpret the V Pattern
Here’s the crucial part – understanding what the market’s really saying when this pattern appears.
The expanding swings show disagreement. Bulls and bears are both active, but neither side’s in full control. Momentum is unstable. The bigger swings reflect rising emotional energy: fear and greed are amplifying. A breakout ends the chaos. Eventually, the market picks a direction. The side that breaks the boundary tends to dominate the next big move.
Now, depending on where the breakout happens, you can interpret it differently:
- Breakout above resistance: Bullish signal. The market’s done shaking out weak hands and is ready to trend higher.
- Breakdown below support: Bearish signal. The market’s capitulating, and sellers are taking charge.
- Volume confirmation helps a lot here: if the breakout happens on high volume, it’s more likely to stick.
Trading Strategies Using This Pattern
Let’s look at a few ways crypto traders approach the V pattern, from conservative to aggressive.
1. The Confirmation Breakout Strategy
This is the most straightforward and beginner-friendly method.
How it works:
- Wait for the V pattern to fully form — sharp drop, clear bottom, sharp rebound.
- Mark the “neckline” (the last lower high before the drop).
- Enter after the price breaks and closes above that neckline with volume.
Why it works:
That breakout confirms that buyers have regained control. It avoids early entries during fakeouts.
Stop-loss: Just below the pivot low (bottom of the V).
Target:
You can aim for the previous resistance zone, or measure the depth of the left leg and project it upward from the breakout point (a classic measured-move approach).
2. The Retest Entry Strategy
More advanced traders prefer to catch the retest after the breakout.
How it works:
- After the V completes and price breaks above resistance, wait for a small pullback to that same level (now acting as support).
- Enter on bullish confirmation – a bounce, a pin bar, or a higher low.
Why it works:
The retest filters out false breakouts and gives a tighter entry with a smaller stop.
Stop-loss: Just below the retest level.
Target:
Same as above – project the height of the pattern or aim for key resistance zones.
3. The Aggressive “Knife-Catch” Entry
This one’s for risk-tolerant traders who have sharp timing and nerves of steel.
How it works:
- Identify capitulation signs: massive red candles, RSI below 25, panic volume.
- Look for a reversal candle (hammer, engulfing) or a bullish divergence on RSI/MACD near major support.
- Enter near the bottom before confirmation.
Why it works:
It allows you to enter at the best possible price – often before the crowd realizes the reversal has started.
The risk: You might catch a falling knife. If price doesn’t bounce immediately, losses stack up fast.
Stop-loss: Set just below the recent low. Do not move it “for more room” — that’s how accounts blow up.
Pro tip: Reduce position size for this type of trade and only use it when volume spikes indicate true capitulation.
4. The V-Pattern Short Strategy (Inverted V)
Everything works in reverse when the pattern flips upside down – an inverted V or V-top. It signals the end of an uptrend and the start of a potential dump.
How to trade it:
- Identify a parabolic rally followed by a sudden sharp drop.
- Wait for a small bounce that fails to reclaim prior highs.
- Enter a short position as price breaks below the neckline or fails a retest.
Stop-loss: Above the recent swing high.
Target: Measure the height of the left leg and project downward.
This version is especially relevant during crypto bull runs, when hype coins blow off tops.
Real-World Examples of the V Pattern in Crypto
Bitcoin’s March 2020 Crash
When COVID panic hit, BTC collapsed from around $9,000 to nearly $3,800 in days. Sentiment was pure fear.
Then, within weeks, price rocketed back above $7,000. That recovery formed one of the cleanest V-shaped reversals in Bitcoin history, kicking off the bull run that peaked in 2021.
Ethereum’s Mid-2022 Recovery
ETH dumped from $2,000 to under $900 as the Terra collapse shook the market. But after that bottom, it rebounded rapidly, forming a near-perfect V. Traders who recognized the pattern and entered on the confirmation breakout doubled their positions in weeks.
Tips for Trading the V Pattern Effectively
- Wait for Volume Confirmation: No strong volume = no strong reversal.
- Use Multiple Timeframes: A V on the 4-hour might look like noise on the 1-hour. Check context.
- Don’t FOMO: The pattern happens fast, but chasing late entries often kills your R/R ratio.
- Secure Profits: Trail stops as price climbs – V reversals can overshoot, then retrace hard.
- Combine with Indicators: RSI divergences, MACD crossovers, and moving averages can all strengthen your setup.
Final Thoughts
The V pattern is one of the most explosive setups in crypto trading – and one of the most emotional. It captures the essence of this market: chaos, panic, and then an unbelievable rebound that leaves half the crowd stunned.
Trading it successfully means understanding not just the shape, but the psychology behind it; the fear, capitulation, and snapback that drive the move.
Patience pays here. Don’t guess the bottom; recognize it. Wait for the signs: volume shift, reversal candle, breakout confirmation, and then let the trend do the work.
When everyone else sees disaster, the V pattern often marks the start of the next opportunity. In crypto, that’s the edge that separates the chart-watchers from the traders who actually pull profit out of the chaos.


